Alsatian vs Immigrants from Oceania Single Male Poverty
COMPARE
Alsatian
Immigrants from Oceania
Single Male Poverty
Single Male Poverty Comparison
Alsatians
Immigrants from Oceania
15.2%
SINGLE MALE POVERTY
0.0/ 100
METRIC RATING
302nd/ 347
METRIC RANK
12.4%
SINGLE MALE POVERTY
91.1/ 100
METRIC RATING
117th/ 347
METRIC RANK
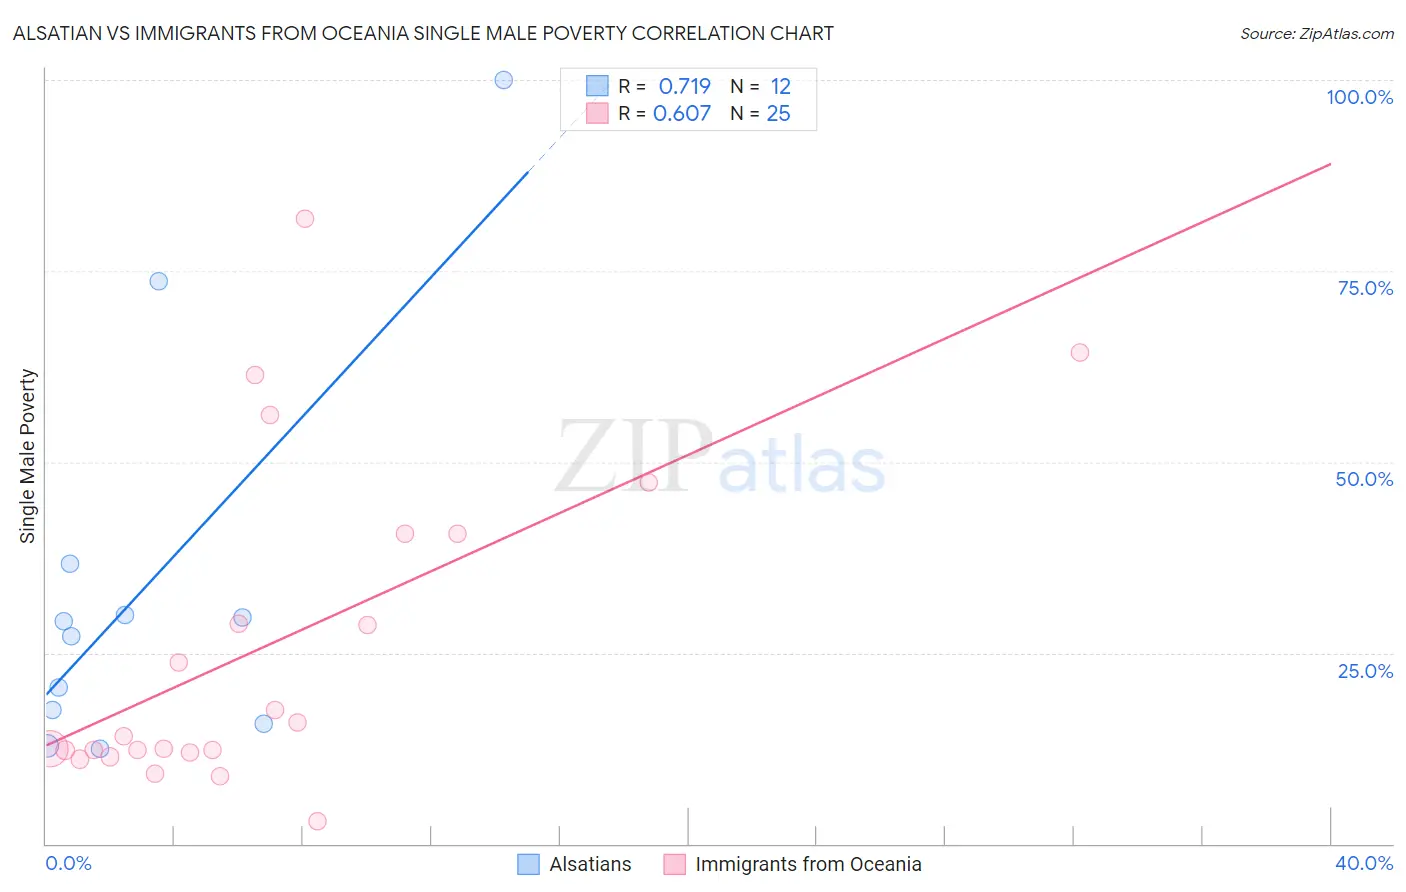
Alsatian vs Immigrants from Oceania Single Male Poverty Correlation Chart
The statistical analysis conducted on geographies consisting of 78,244,917 people shows a strong positive correlation between the proportion of Alsatians and poverty level among single males in the United States with a correlation coefficient (R) of 0.719 and weighted average of 15.2%. Similarly, the statistical analysis conducted on geographies consisting of 275,455,617 people shows a significant positive correlation between the proportion of Immigrants from Oceania and poverty level among single males in the United States with a correlation coefficient (R) of 0.607 and weighted average of 12.4%, a difference of 22.9%.
Single Male Poverty Correlation Summary
| Measurement | Alsatian | Immigrants from Oceania |
| Minimum | 12.5% | 3.0% |
| Maximum | 100.0% | 81.8% |
| Range | 87.5% | 78.9% |
| Mean | 33.8% | 26.0% |
| Median | 28.1% | 14.1% |
| Interquartile 25% (IQ1) | 16.6% | 12.1% |
| Interquartile 75% (IQ3) | 33.3% | 40.5% |
| Interquartile Range (IQR) | 16.7% | 28.4% |
| Standard Deviation (Sample) | 26.5% | 21.2% |
| Standard Deviation (Population) | 25.4% | 20.8% |
Similar Demographics by Single Male Poverty
Demographics Similar to Alsatians by Single Male Poverty
In terms of single male poverty, the demographic groups most similar to Alsatians are Dominican (15.2%, a difference of 0.16%), Cree (15.1%, a difference of 0.98%), Aleut (15.4%, a difference of 1.0%), Alaska Native (15.4%, a difference of 1.1%), and Delaware (15.0%, a difference of 1.4%).
| Demographics | Rating | Rank | Single Male Poverty |
| Scotch-Irish | 0.0 /100 | #295 | Tragic 14.7% |
| Africans | 0.0 /100 | #296 | Tragic 14.7% |
| Immigrants | Dominican Republic | 0.0 /100 | #297 | Tragic 14.8% |
| French American Indians | 0.0 /100 | #298 | Tragic 15.0% |
| Delaware | 0.0 /100 | #299 | Tragic 15.0% |
| Cree | 0.0 /100 | #300 | Tragic 15.1% |
| Dominicans | 0.0 /100 | #301 | Tragic 15.2% |
| Alsatians | 0.0 /100 | #302 | Tragic 15.2% |
| Aleuts | 0.0 /100 | #303 | Tragic 15.4% |
| Alaska Natives | 0.0 /100 | #304 | Tragic 15.4% |
| Blackfeet | 0.0 /100 | #305 | Tragic 15.5% |
| Pennsylvania Germans | 0.0 /100 | #306 | Tragic 15.6% |
| Ute | 0.0 /100 | #307 | Tragic 15.7% |
| Potawatomi | 0.0 /100 | #308 | Tragic 15.8% |
| Americans | 0.0 /100 | #309 | Tragic 15.8% |
Demographics Similar to Immigrants from Oceania by Single Male Poverty
In terms of single male poverty, the demographic groups most similar to Immigrants from Oceania are Immigrants from Syria (12.4%, a difference of 0.010%), Immigrants from Southern Europe (12.4%, a difference of 0.070%), Albanian (12.4%, a difference of 0.10%), Immigrants from Albania (12.4%, a difference of 0.13%), and Nicaraguan (12.4%, a difference of 0.18%).
| Demographics | Rating | Rank | Single Male Poverty |
| Immigrants | Portugal | 93.6 /100 | #110 | Exceptional 12.3% |
| Immigrants | North Macedonia | 93.6 /100 | #111 | Exceptional 12.3% |
| Kenyans | 93.3 /100 | #112 | Exceptional 12.4% |
| Pakistanis | 92.4 /100 | #113 | Exceptional 12.4% |
| Nicaraguans | 92.1 /100 | #114 | Exceptional 12.4% |
| Immigrants | Southern Europe | 91.5 /100 | #115 | Exceptional 12.4% |
| Immigrants | Syria | 91.2 /100 | #116 | Exceptional 12.4% |
| Immigrants | Oceania | 91.1 /100 | #117 | Exceptional 12.4% |
| Albanians | 90.6 /100 | #118 | Exceptional 12.4% |
| Immigrants | Albania | 90.3 /100 | #119 | Exceptional 12.4% |
| Venezuelans | 89.4 /100 | #120 | Excellent 12.4% |
| Icelanders | 88.2 /100 | #121 | Excellent 12.5% |
| Serbians | 87.9 /100 | #122 | Excellent 12.5% |
| Immigrants | Kenya | 87.6 /100 | #123 | Excellent 12.5% |
| Russians | 87.3 /100 | #124 | Excellent 12.5% |