Alsatian vs Tsimshian Single Male Poverty
COMPARE
Alsatian
Tsimshian
Single Male Poverty
Single Male Poverty Comparison
Alsatians
Tsimshian
15.2%
SINGLE MALE POVERTY
0.0/ 100
METRIC RATING
302nd/ 347
METRIC RANK
11.1%
SINGLE MALE POVERTY
100.0/ 100
METRIC RATING
17th/ 347
METRIC RANK
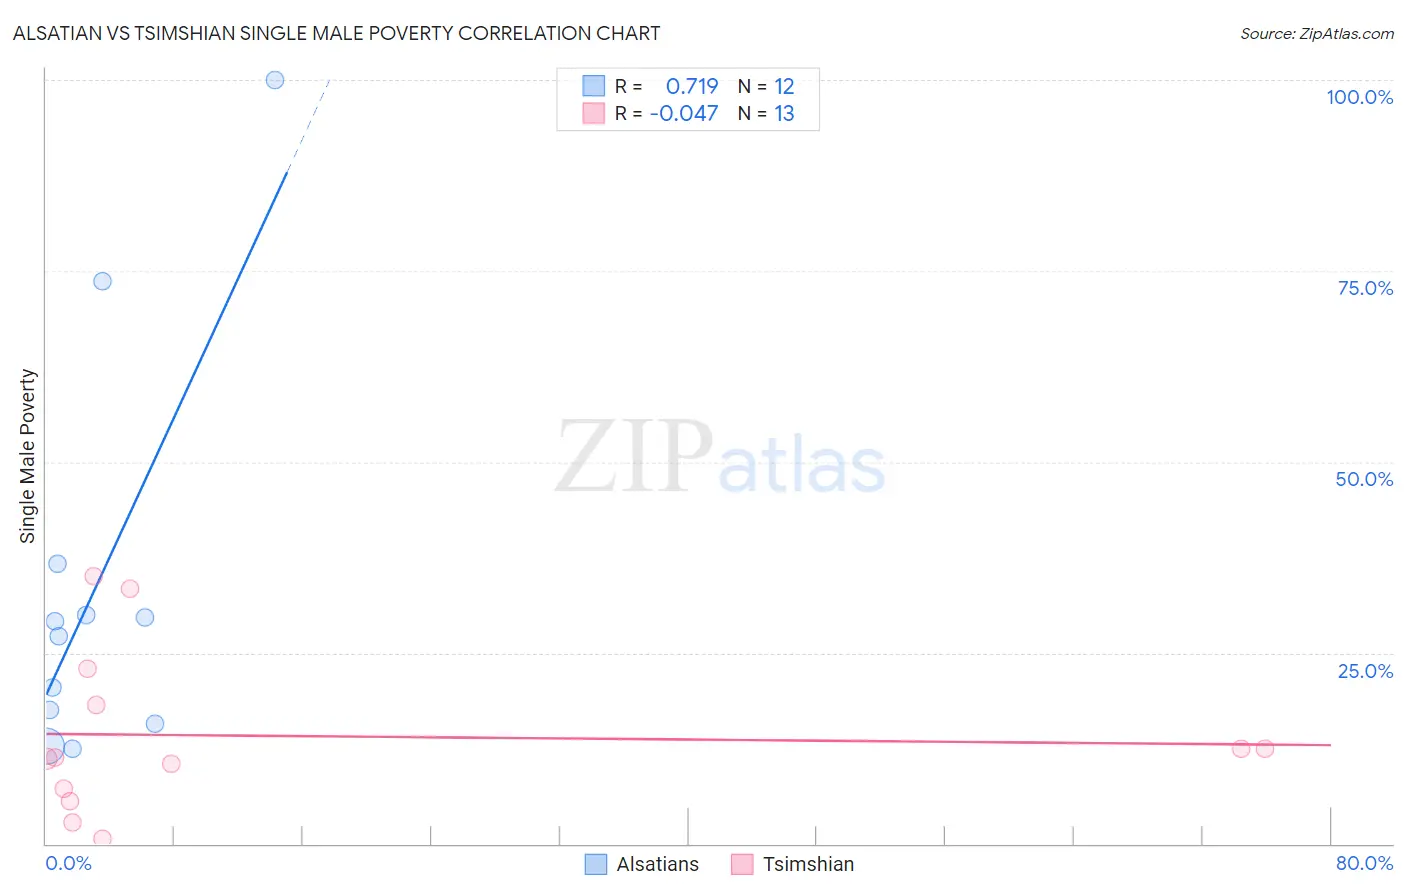
Alsatian vs Tsimshian Single Male Poverty Correlation Chart
The statistical analysis conducted on geographies consisting of 78,244,917 people shows a strong positive correlation between the proportion of Alsatians and poverty level among single males in the United States with a correlation coefficient (R) of 0.719 and weighted average of 15.2%. Similarly, the statistical analysis conducted on geographies consisting of 15,184,225 people shows no correlation between the proportion of Tsimshian and poverty level among single males in the United States with a correlation coefficient (R) of -0.047 and weighted average of 11.1%, a difference of 37.5%.
Single Male Poverty Correlation Summary
| Measurement | Alsatian | Tsimshian |
| Minimum | 12.5% | 0.66% |
| Maximum | 100.0% | 35.0% |
| Range | 87.5% | 34.3% |
| Mean | 33.8% | 14.1% |
| Median | 28.1% | 11.2% |
| Interquartile 25% (IQ1) | 16.6% | 6.4% |
| Interquartile 75% (IQ3) | 33.3% | 20.6% |
| Interquartile Range (IQR) | 16.7% | 14.2% |
| Standard Deviation (Sample) | 26.5% | 10.7% |
| Standard Deviation (Population) | 25.4% | 10.2% |
Similar Demographics by Single Male Poverty
Demographics Similar to Alsatians by Single Male Poverty
In terms of single male poverty, the demographic groups most similar to Alsatians are Dominican (15.2%, a difference of 0.16%), Cree (15.1%, a difference of 0.98%), Aleut (15.4%, a difference of 1.0%), Alaska Native (15.4%, a difference of 1.1%), and Delaware (15.0%, a difference of 1.4%).
| Demographics | Rating | Rank | Single Male Poverty |
| Scotch-Irish | 0.0 /100 | #295 | Tragic 14.7% |
| Africans | 0.0 /100 | #296 | Tragic 14.7% |
| Immigrants | Dominican Republic | 0.0 /100 | #297 | Tragic 14.8% |
| French American Indians | 0.0 /100 | #298 | Tragic 15.0% |
| Delaware | 0.0 /100 | #299 | Tragic 15.0% |
| Cree | 0.0 /100 | #300 | Tragic 15.1% |
| Dominicans | 0.0 /100 | #301 | Tragic 15.2% |
| Alsatians | 0.0 /100 | #302 | Tragic 15.2% |
| Aleuts | 0.0 /100 | #303 | Tragic 15.4% |
| Alaska Natives | 0.0 /100 | #304 | Tragic 15.4% |
| Blackfeet | 0.0 /100 | #305 | Tragic 15.5% |
| Pennsylvania Germans | 0.0 /100 | #306 | Tragic 15.6% |
| Ute | 0.0 /100 | #307 | Tragic 15.7% |
| Potawatomi | 0.0 /100 | #308 | Tragic 15.8% |
| Americans | 0.0 /100 | #309 | Tragic 15.8% |
Demographics Similar to Tsimshian by Single Male Poverty
In terms of single male poverty, the demographic groups most similar to Tsimshian are Bhutanese (11.1%, a difference of 0.090%), Immigrants from Bolivia (11.1%, a difference of 0.33%), Immigrants from Moldova (11.2%, a difference of 0.72%), Ethiopian (11.2%, a difference of 0.74%), and Korean (11.0%, a difference of 0.85%).
| Demographics | Rating | Rank | Single Male Poverty |
| Immigrants | Fiji | 100.0 /100 | #10 | Exceptional 10.9% |
| Immigrants | Philippines | 100.0 /100 | #11 | Exceptional 10.9% |
| Immigrants | Afghanistan | 100.0 /100 | #12 | Exceptional 10.9% |
| Immigrants | South Central Asia | 100.0 /100 | #13 | Exceptional 10.9% |
| Chinese | 100.0 /100 | #14 | Exceptional 11.0% |
| Koreans | 100.0 /100 | #15 | Exceptional 11.0% |
| Bhutanese | 100.0 /100 | #16 | Exceptional 11.1% |
| Tsimshian | 100.0 /100 | #17 | Exceptional 11.1% |
| Immigrants | Bolivia | 100.0 /100 | #18 | Exceptional 11.1% |
| Immigrants | Moldova | 100.0 /100 | #19 | Exceptional 11.2% |
| Ethiopians | 100.0 /100 | #20 | Exceptional 11.2% |
| Asians | 100.0 /100 | #21 | Exceptional 11.2% |
| Immigrants | Pakistan | 100.0 /100 | #22 | Exceptional 11.2% |
| Bolivians | 100.0 /100 | #23 | Exceptional 11.2% |
| Indians (Asian) | 100.0 /100 | #24 | Exceptional 11.3% |