Alsatian vs Immigrants from Lithuania 11th Grade
COMPARE
Alsatian
Immigrants from Lithuania
11th Grade
11th Grade Comparison
Alsatians
Immigrants from Lithuania
92.6%
11TH GRADE
60.2/ 100
METRIC RATING
167th/ 347
METRIC RANK
94.1%
11TH GRADE
99.9/ 100
METRIC RATING
39th/ 347
METRIC RANK
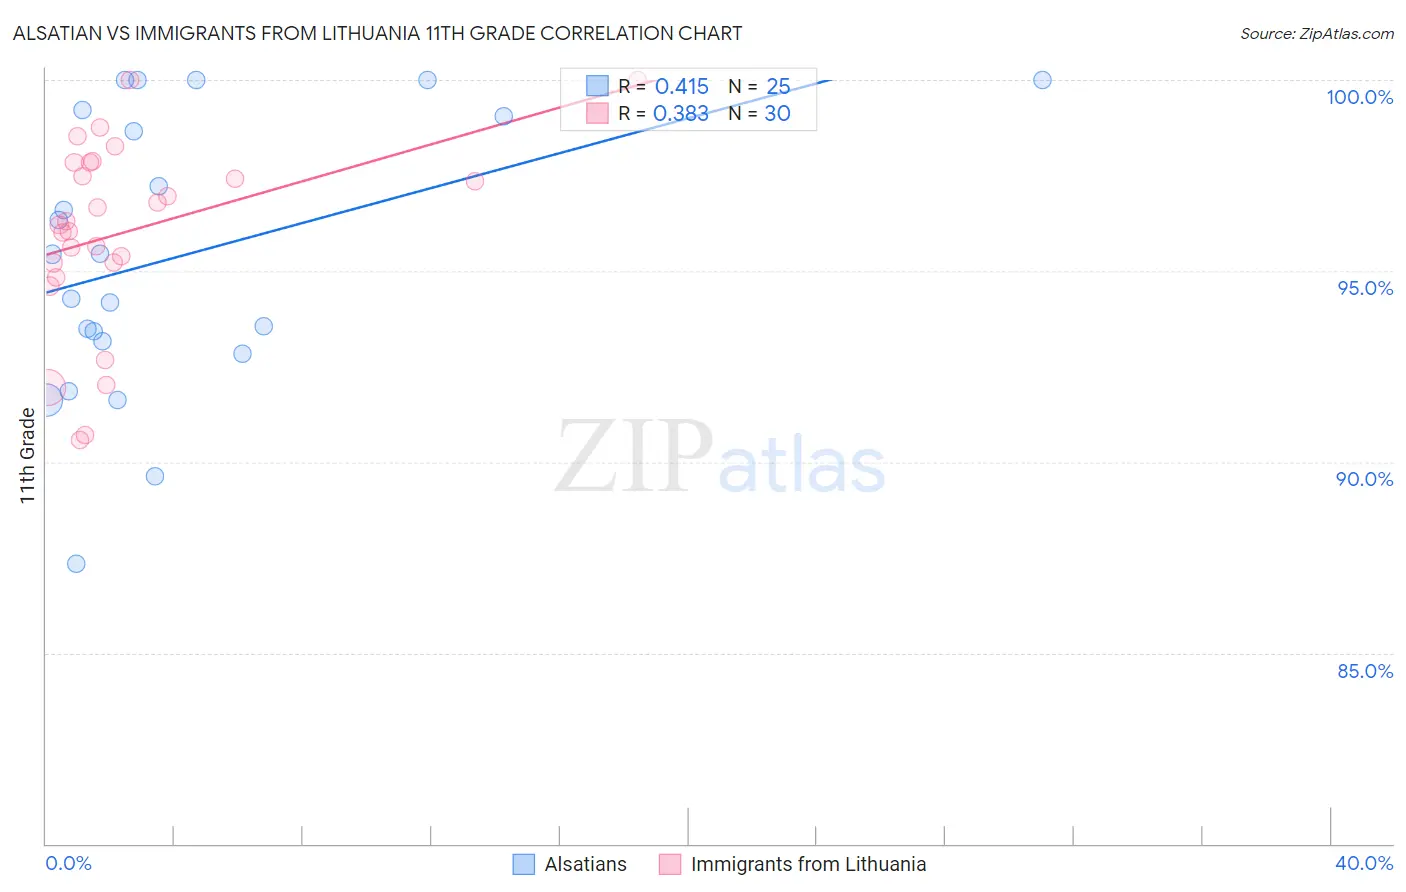
Alsatian vs Immigrants from Lithuania 11th Grade Correlation Chart
The statistical analysis conducted on geographies consisting of 82,682,365 people shows a moderate positive correlation between the proportion of Alsatians and percentage of population with at least 11th grade education in the United States with a correlation coefficient (R) of 0.415 and weighted average of 92.6%. Similarly, the statistical analysis conducted on geographies consisting of 117,724,932 people shows a mild positive correlation between the proportion of Immigrants from Lithuania and percentage of population with at least 11th grade education in the United States with a correlation coefficient (R) of 0.383 and weighted average of 94.1%, a difference of 1.6%.
11th Grade Correlation Summary
| Measurement | Alsatian | Immigrants from Lithuania |
| Minimum | 87.3% | 90.6% |
| Maximum | 100.0% | 100.0% |
| Range | 12.7% | 9.4% |
| Mean | 95.4% | 96.0% |
| Median | 95.4% | 96.2% |
| Interquartile 25% (IQ1) | 93.0% | 95.2% |
| Interquartile 75% (IQ3) | 99.1% | 97.8% |
| Interquartile Range (IQR) | 6.1% | 2.6% |
| Standard Deviation (Sample) | 3.6% | 2.5% |
| Standard Deviation (Population) | 3.6% | 2.4% |
Similar Demographics by 11th Grade
Demographics Similar to Alsatians by 11th Grade
In terms of 11th grade, the demographic groups most similar to Alsatians are Bermudan (92.6%, a difference of 0.020%), Sierra Leonean (92.6%, a difference of 0.020%), Immigrants from Albania (92.6%, a difference of 0.020%), Immigrants from Northern Africa (92.6%, a difference of 0.030%), and Immigrants from Iraq (92.6%, a difference of 0.040%).
| Demographics | Rating | Rank | 11th Grade |
| Immigrants | Lebanon | 70.7 /100 | #160 | Good 92.7% |
| Immigrants | Argentina | 69.8 /100 | #161 | Good 92.7% |
| Paraguayans | 68.7 /100 | #162 | Good 92.7% |
| Immigrants | Nonimmigrants | 66.6 /100 | #163 | Good 92.7% |
| Spanish | 66.2 /100 | #164 | Good 92.7% |
| Immigrants | Iraq | 63.7 /100 | #165 | Good 92.6% |
| Bermudans | 62.3 /100 | #166 | Good 92.6% |
| Alsatians | 60.2 /100 | #167 | Good 92.6% |
| Sierra Leoneans | 58.7 /100 | #168 | Average 92.6% |
| Immigrants | Albania | 57.8 /100 | #169 | Average 92.6% |
| Immigrants | Northern Africa | 57.3 /100 | #170 | Average 92.6% |
| Laotians | 54.4 /100 | #171 | Average 92.6% |
| Immigrants | Pakistan | 52.3 /100 | #172 | Average 92.5% |
| Indians (Asian) | 51.5 /100 | #173 | Average 92.5% |
| Asians | 50.0 /100 | #174 | Average 92.5% |
Demographics Similar to Immigrants from Lithuania by 11th Grade
In terms of 11th grade, the demographic groups most similar to Immigrants from Lithuania are Thai (94.1%, a difference of 0.0%), Cypriot (94.1%, a difference of 0.010%), Immigrants from Austria (94.1%, a difference of 0.020%), Greek (94.1%, a difference of 0.020%), and Immigrants from Ireland (94.1%, a difference of 0.030%).
| Demographics | Rating | Rank | 11th Grade |
| Belgians | 99.9 /100 | #32 | Exceptional 94.2% |
| British | 99.9 /100 | #33 | Exceptional 94.2% |
| Immigrants | Scotland | 99.9 /100 | #34 | Exceptional 94.2% |
| Immigrants | Singapore | 99.9 /100 | #35 | Exceptional 94.2% |
| Immigrants | Northern Europe | 99.9 /100 | #36 | Exceptional 94.2% |
| Northern Europeans | 99.9 /100 | #37 | Exceptional 94.2% |
| Hungarians | 99.9 /100 | #38 | Exceptional 94.2% |
| Immigrants | Lithuania | 99.9 /100 | #39 | Exceptional 94.1% |
| Thais | 99.9 /100 | #40 | Exceptional 94.1% |
| Cypriots | 99.9 /100 | #41 | Exceptional 94.1% |
| Immigrants | Austria | 99.9 /100 | #42 | Exceptional 94.1% |
| Greeks | 99.9 /100 | #43 | Exceptional 94.1% |
| Immigrants | Ireland | 99.9 /100 | #44 | Exceptional 94.1% |
| Australians | 99.9 /100 | #45 | Exceptional 94.1% |
| Serbians | 99.9 /100 | #46 | Exceptional 94.1% |