Alsatian vs Native Hawaiian Single Male Poverty
COMPARE
Alsatian
Native Hawaiian
Single Male Poverty
Single Male Poverty Comparison
Alsatians
Native Hawaiians
15.2%
SINGLE MALE POVERTY
0.0/ 100
METRIC RATING
302nd/ 347
METRIC RANK
12.6%
SINGLE MALE POVERTY
75.0/ 100
METRIC RATING
146th/ 347
METRIC RANK
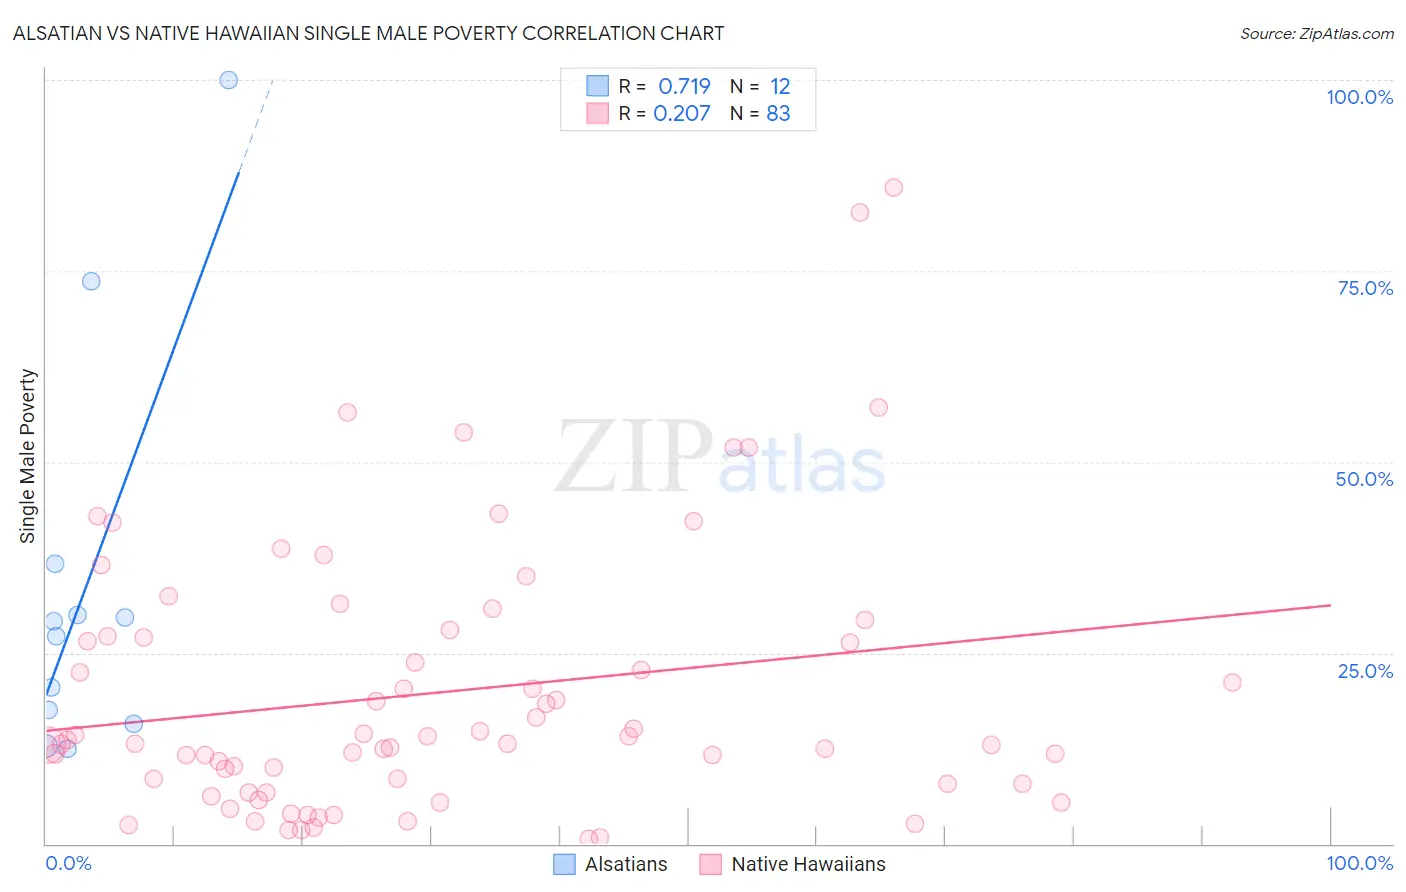
Alsatian vs Native Hawaiian Single Male Poverty Correlation Chart
The statistical analysis conducted on geographies consisting of 78,244,917 people shows a strong positive correlation between the proportion of Alsatians and poverty level among single males in the United States with a correlation coefficient (R) of 0.719 and weighted average of 15.2%. Similarly, the statistical analysis conducted on geographies consisting of 302,802,945 people shows a weak positive correlation between the proportion of Native Hawaiians and poverty level among single males in the United States with a correlation coefficient (R) of 0.207 and weighted average of 12.6%, a difference of 20.8%.
Single Male Poverty Correlation Summary
| Measurement | Alsatian | Native Hawaiian |
| Minimum | 12.5% | 0.72% |
| Maximum | 100.0% | 86.0% |
| Range | 87.5% | 85.3% |
| Mean | 33.8% | 19.8% |
| Median | 28.1% | 13.1% |
| Interquartile 25% (IQ1) | 16.6% | 7.9% |
| Interquartile 75% (IQ3) | 33.3% | 27.2% |
| Interquartile Range (IQR) | 16.7% | 19.3% |
| Standard Deviation (Sample) | 26.5% | 17.6% |
| Standard Deviation (Population) | 25.4% | 17.5% |
Similar Demographics by Single Male Poverty
Demographics Similar to Alsatians by Single Male Poverty
In terms of single male poverty, the demographic groups most similar to Alsatians are Dominican (15.2%, a difference of 0.16%), Cree (15.1%, a difference of 0.98%), Aleut (15.4%, a difference of 1.0%), Alaska Native (15.4%, a difference of 1.1%), and Delaware (15.0%, a difference of 1.4%).
| Demographics | Rating | Rank | Single Male Poverty |
| Scotch-Irish | 0.0 /100 | #295 | Tragic 14.7% |
| Africans | 0.0 /100 | #296 | Tragic 14.7% |
| Immigrants | Dominican Republic | 0.0 /100 | #297 | Tragic 14.8% |
| French American Indians | 0.0 /100 | #298 | Tragic 15.0% |
| Delaware | 0.0 /100 | #299 | Tragic 15.0% |
| Cree | 0.0 /100 | #300 | Tragic 15.1% |
| Dominicans | 0.0 /100 | #301 | Tragic 15.2% |
| Alsatians | 0.0 /100 | #302 | Tragic 15.2% |
| Aleuts | 0.0 /100 | #303 | Tragic 15.4% |
| Alaska Natives | 0.0 /100 | #304 | Tragic 15.4% |
| Blackfeet | 0.0 /100 | #305 | Tragic 15.5% |
| Pennsylvania Germans | 0.0 /100 | #306 | Tragic 15.6% |
| Ute | 0.0 /100 | #307 | Tragic 15.7% |
| Potawatomi | 0.0 /100 | #308 | Tragic 15.8% |
| Americans | 0.0 /100 | #309 | Tragic 15.8% |
Demographics Similar to Native Hawaiians by Single Male Poverty
In terms of single male poverty, the demographic groups most similar to Native Hawaiians are Immigrants from Lebanon (12.6%, a difference of 0.0%), Hawaiian (12.6%, a difference of 0.010%), Malaysian (12.6%, a difference of 0.010%), Immigrants from France (12.6%, a difference of 0.060%), and Okinawan (12.6%, a difference of 0.070%).
| Demographics | Rating | Rank | Single Male Poverty |
| Cubans | 79.9 /100 | #139 | Good 12.6% |
| Immigrants | Zimbabwe | 78.0 /100 | #140 | Good 12.6% |
| Okinawans | 75.9 /100 | #141 | Good 12.6% |
| Immigrants | Uganda | 75.9 /100 | #142 | Good 12.6% |
| Immigrants | France | 75.8 /100 | #143 | Good 12.6% |
| Hawaiians | 75.1 /100 | #144 | Good 12.6% |
| Immigrants | Lebanon | 75.0 /100 | #145 | Good 12.6% |
| Native Hawaiians | 75.0 /100 | #146 | Good 12.6% |
| Malaysians | 74.8 /100 | #147 | Good 12.6% |
| Yugoslavians | 73.9 /100 | #148 | Good 12.6% |
| Sierra Leoneans | 73.0 /100 | #149 | Good 12.6% |
| Immigrants | Panama | 72.1 /100 | #150 | Good 12.6% |
| Immigrants | Hungary | 71.9 /100 | #151 | Good 12.6% |
| Australians | 71.4 /100 | #152 | Good 12.6% |
| Immigrants | Immigrants | 70.1 /100 | #153 | Good 12.7% |