Afghan vs Soviet Union Median Earnings
COMPARE
Afghan
Soviet Union
Median Earnings
Median Earnings Comparison
Afghans
Soviet Union
$51,112
MEDIAN EARNINGS
99.9/ 100
METRIC RATING
66th/ 347
METRIC RANK
$54,290
MEDIAN EARNINGS
100.0/ 100
METRIC RATING
24th/ 347
METRIC RANK
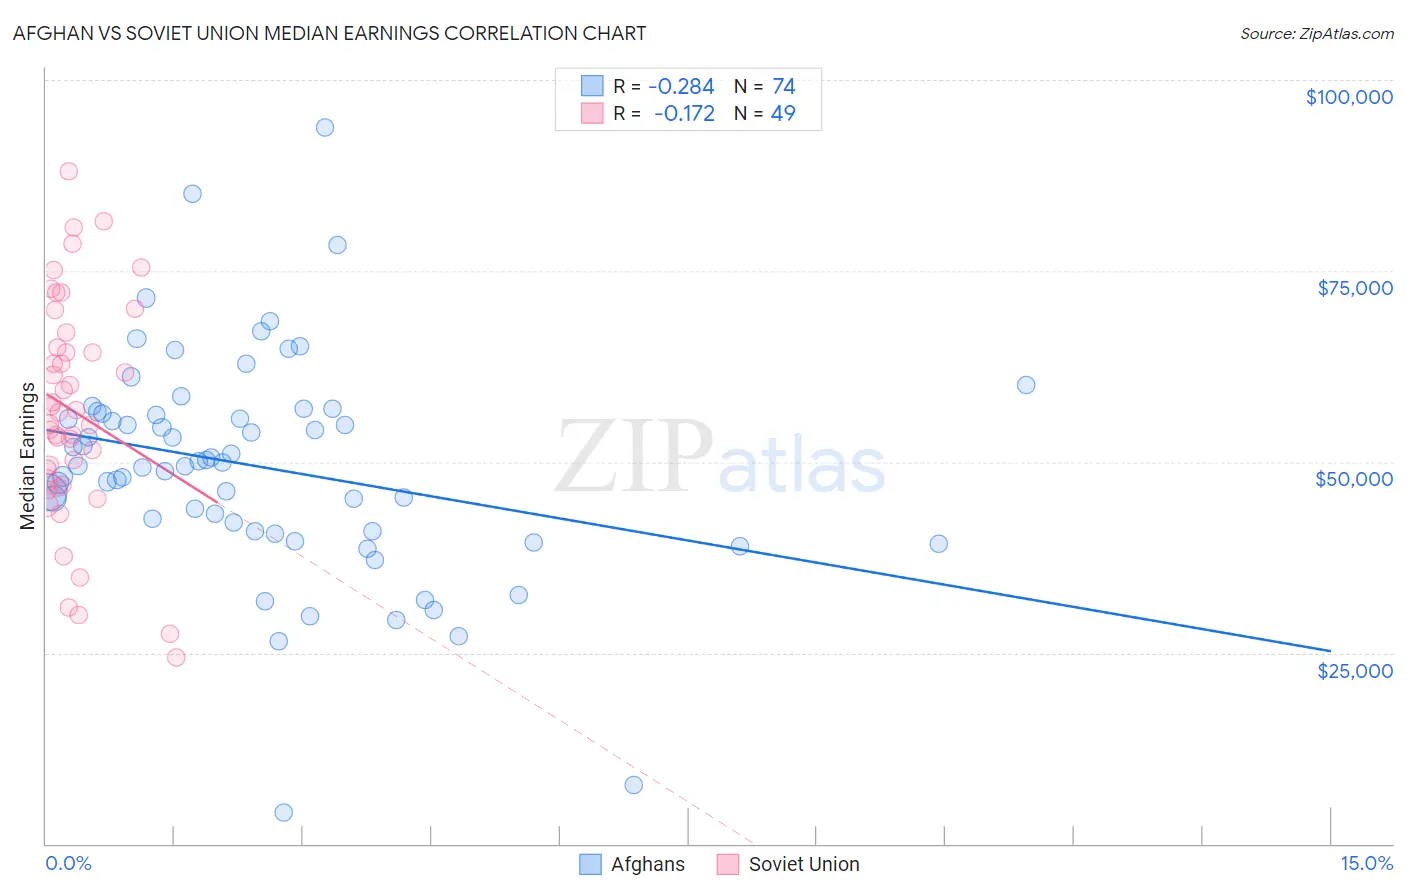
Afghan vs Soviet Union Median Earnings Correlation Chart
The statistical analysis conducted on geographies consisting of 148,874,377 people shows a weak negative correlation between the proportion of Afghans and median earnings in the United States with a correlation coefficient (R) of -0.284 and weighted average of $51,112. Similarly, the statistical analysis conducted on geographies consisting of 43,511,973 people shows a poor negative correlation between the proportion of Soviet Union and median earnings in the United States with a correlation coefficient (R) of -0.172 and weighted average of $54,290, a difference of 6.2%.
Median Earnings Correlation Summary
| Measurement | Afghan | Soviet Union |
| Minimum | $4,034 | $24,432 |
| Maximum | $93,750 | $88,077 |
| Range | $89,716 | $63,645 |
| Mean | $49,335 | $56,673 |
| Median | $49,670 | $56,451 |
| Interquartile 25% (IQ1) | $40,877 | $47,287 |
| Interquartile 75% (IQ3) | $56,283 | $65,993 |
| Interquartile Range (IQR) | $15,406 | $18,706 |
| Standard Deviation (Sample) | $14,513 | $14,478 |
| Standard Deviation (Population) | $14,415 | $14,329 |
Similar Demographics by Median Earnings
Demographics Similar to Afghans by Median Earnings
In terms of median earnings, the demographic groups most similar to Afghans are Immigrants from Spain ($51,092, a difference of 0.040%), Paraguayan ($51,068, a difference of 0.090%), Greek ($51,164, a difference of 0.10%), Mongolian ($51,038, a difference of 0.15%), and Lithuanian ($50,991, a difference of 0.24%).
| Demographics | Rating | Rank | Median Earnings |
| Immigrants | Croatia | 99.9 /100 | #59 | Exceptional $51,581 |
| Immigrants | Serbia | 99.9 /100 | #60 | Exceptional $51,557 |
| Immigrants | Latvia | 99.9 /100 | #61 | Exceptional $51,555 |
| Immigrants | Romania | 99.9 /100 | #62 | Exceptional $51,337 |
| Immigrants | Bulgaria | 99.9 /100 | #63 | Exceptional $51,318 |
| New Zealanders | 99.9 /100 | #64 | Exceptional $51,246 |
| Greeks | 99.9 /100 | #65 | Exceptional $51,164 |
| Afghans | 99.9 /100 | #66 | Exceptional $51,112 |
| Immigrants | Spain | 99.9 /100 | #67 | Exceptional $51,092 |
| Paraguayans | 99.9 /100 | #68 | Exceptional $51,068 |
| Mongolians | 99.8 /100 | #69 | Exceptional $51,038 |
| Lithuanians | 99.8 /100 | #70 | Exceptional $50,991 |
| Immigrants | Ukraine | 99.8 /100 | #71 | Exceptional $50,984 |
| Immigrants | Egypt | 99.8 /100 | #72 | Exceptional $50,901 |
| Immigrants | Netherlands | 99.8 /100 | #73 | Exceptional $50,818 |
Demographics Similar to Soviet Union by Median Earnings
In terms of median earnings, the demographic groups most similar to Soviet Union are Immigrants from Sweden ($54,478, a difference of 0.35%), Immigrants from Korea ($54,530, a difference of 0.44%), Burmese ($54,559, a difference of 0.50%), Cypriot ($54,589, a difference of 0.55%), and Turkish ($53,919, a difference of 0.69%).
| Demographics | Rating | Rank | Median Earnings |
| Eastern Europeans | 100.0 /100 | #17 | Exceptional $55,084 |
| Immigrants | Japan | 100.0 /100 | #18 | Exceptional $54,938 |
| Immigrants | Belgium | 100.0 /100 | #19 | Exceptional $54,679 |
| Cypriots | 100.0 /100 | #20 | Exceptional $54,589 |
| Burmese | 100.0 /100 | #21 | Exceptional $54,559 |
| Immigrants | Korea | 100.0 /100 | #22 | Exceptional $54,530 |
| Immigrants | Sweden | 100.0 /100 | #23 | Exceptional $54,478 |
| Soviet Union | 100.0 /100 | #24 | Exceptional $54,290 |
| Turks | 100.0 /100 | #25 | Exceptional $53,919 |
| Immigrants | Northern Europe | 100.0 /100 | #26 | Exceptional $53,872 |
| Asians | 100.0 /100 | #27 | Exceptional $53,690 |
| Immigrants | France | 100.0 /100 | #28 | Exceptional $53,490 |
| Immigrants | Russia | 100.0 /100 | #29 | Exceptional $53,457 |
| Cambodians | 100.0 /100 | #30 | Exceptional $53,386 |
| Russians | 100.0 /100 | #31 | Exceptional $53,334 |