Afghan vs Soviet Union In Labor Force | Age 30-34
COMPARE
Afghan
Soviet Union
In Labor Force | Age 30-34
In Labor Force | Age 30-34 Comparison
Afghans
Soviet Union
84.7%
IN LABOR FORCE | AGE 30-34
55.2/ 100
METRIC RATING
166th/ 347
METRIC RANK
85.5%
IN LABOR FORCE | AGE 30-34
99.4/ 100
METRIC RATING
62nd/ 347
METRIC RANK
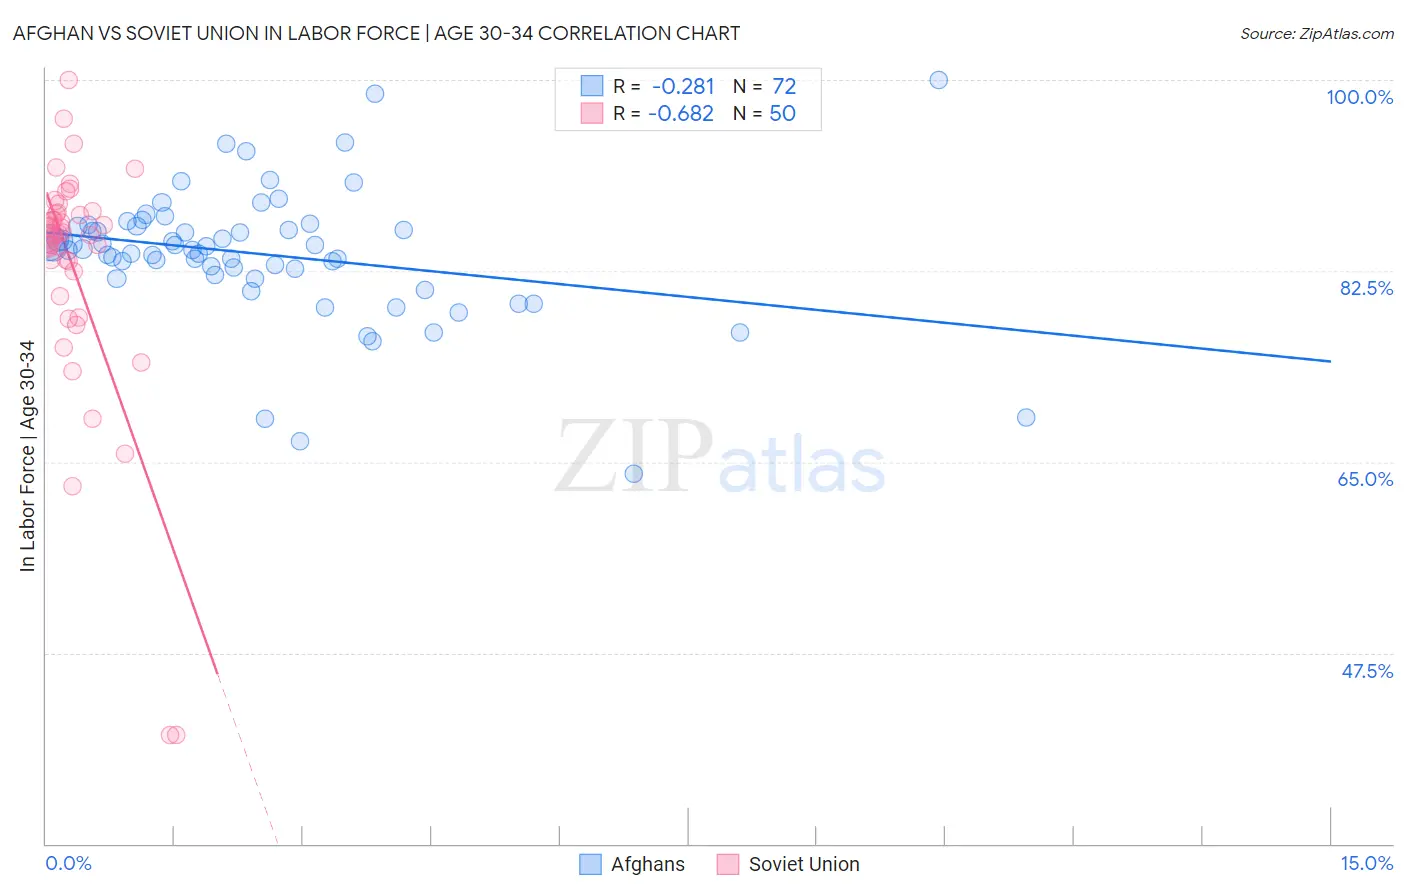
Afghan vs Soviet Union In Labor Force | Age 30-34 Correlation Chart
The statistical analysis conducted on geographies consisting of 148,857,099 people shows a weak negative correlation between the proportion of Afghans and labor force participation rate among population between the ages 30 and 34 in the United States with a correlation coefficient (R) of -0.281 and weighted average of 84.7%. Similarly, the statistical analysis conducted on geographies consisting of 43,512,203 people shows a significant negative correlation between the proportion of Soviet Union and labor force participation rate among population between the ages 30 and 34 in the United States with a correlation coefficient (R) of -0.682 and weighted average of 85.5%, a difference of 0.87%.
In Labor Force | Age 30-34 Correlation Summary
| Measurement | Afghan | Soviet Union |
| Minimum | 63.9% | 40.0% |
| Maximum | 100.0% | 100.0% |
| Range | 36.1% | 60.0% |
| Mean | 84.1% | 82.8% |
| Median | 84.5% | 85.9% |
| Interquartile 25% (IQ1) | 82.4% | 82.5% |
| Interquartile 75% (IQ3) | 86.6% | 87.8% |
| Interquartile Range (IQR) | 4.2% | 5.3% |
| Standard Deviation (Sample) | 6.1% | 11.2% |
| Standard Deviation (Population) | 6.0% | 11.1% |
Similar Demographics by In Labor Force | Age 30-34
Demographics Similar to Afghans by In Labor Force | Age 30-34
In terms of in labor force | age 30-34, the demographic groups most similar to Afghans are Icelander (84.7%, a difference of 0.010%), Immigrants from Western Europe (84.7%, a difference of 0.010%), Immigrants from South Eastern Asia (84.7%, a difference of 0.010%), South American (84.7%, a difference of 0.020%), and Immigrants from Uruguay (84.7%, a difference of 0.020%).
| Demographics | Rating | Rank | In Labor Force | Age 30-34 |
| Czechoslovakians | 63.0 /100 | #159 | Good 84.8% |
| Pakistanis | 60.8 /100 | #160 | Good 84.7% |
| Immigrants | Cambodia | 60.7 /100 | #161 | Good 84.7% |
| South Americans | 58.7 /100 | #162 | Average 84.7% |
| Immigrants | Uruguay | 57.4 /100 | #163 | Average 84.7% |
| Icelanders | 56.8 /100 | #164 | Average 84.7% |
| Immigrants | Western Europe | 56.7 /100 | #165 | Average 84.7% |
| Afghans | 55.2 /100 | #166 | Average 84.7% |
| Immigrants | South Eastern Asia | 54.2 /100 | #167 | Average 84.7% |
| Immigrants | Peru | 52.4 /100 | #168 | Average 84.7% |
| South American Indians | 52.1 /100 | #169 | Average 84.7% |
| Immigrants | Burma/Myanmar | 52.0 /100 | #170 | Average 84.7% |
| Irish | 52.0 /100 | #171 | Average 84.7% |
| Immigrants | England | 51.7 /100 | #172 | Average 84.7% |
| Israelis | 51.1 /100 | #173 | Average 84.7% |
Demographics Similar to Soviet Union by In Labor Force | Age 30-34
In terms of in labor force | age 30-34, the demographic groups most similar to Soviet Union are Macedonian (85.5%, a difference of 0.0%), Immigrants from France (85.5%, a difference of 0.010%), Immigrants from Brazil (85.5%, a difference of 0.010%), Italian (85.4%, a difference of 0.010%), and Senegalese (85.4%, a difference of 0.020%).
| Demographics | Rating | Rank | In Labor Force | Age 30-34 |
| Immigrants | Turkey | 99.6 /100 | #55 | Exceptional 85.5% |
| Czechs | 99.6 /100 | #56 | Exceptional 85.5% |
| Russians | 99.6 /100 | #57 | Exceptional 85.5% |
| Poles | 99.6 /100 | #58 | Exceptional 85.5% |
| Immigrants | Poland | 99.5 /100 | #59 | Exceptional 85.5% |
| Immigrants | France | 99.5 /100 | #60 | Exceptional 85.5% |
| Immigrants | Brazil | 99.5 /100 | #61 | Exceptional 85.5% |
| Soviet Union | 99.4 /100 | #62 | Exceptional 85.5% |
| Macedonians | 99.4 /100 | #63 | Exceptional 85.5% |
| Italians | 99.4 /100 | #64 | Exceptional 85.4% |
| Senegalese | 99.4 /100 | #65 | Exceptional 85.4% |
| Ghanaians | 99.4 /100 | #66 | Exceptional 85.4% |
| Kenyans | 99.3 /100 | #67 | Exceptional 85.4% |
| Immigrants | Eastern Europe | 99.3 /100 | #68 | Exceptional 85.4% |
| Immigrants | Iran | 99.2 /100 | #69 | Exceptional 85.4% |