Afghan vs Soviet Union 10th Grade
COMPARE
Afghan
Soviet Union
10th Grade
10th Grade Comparison
Afghans
Soviet Union
93.1%
10TH GRADE
4.5/ 100
METRIC RATING
236th/ 347
METRIC RANK
94.6%
10TH GRADE
98.3/ 100
METRIC RATING
93rd/ 347
METRIC RANK
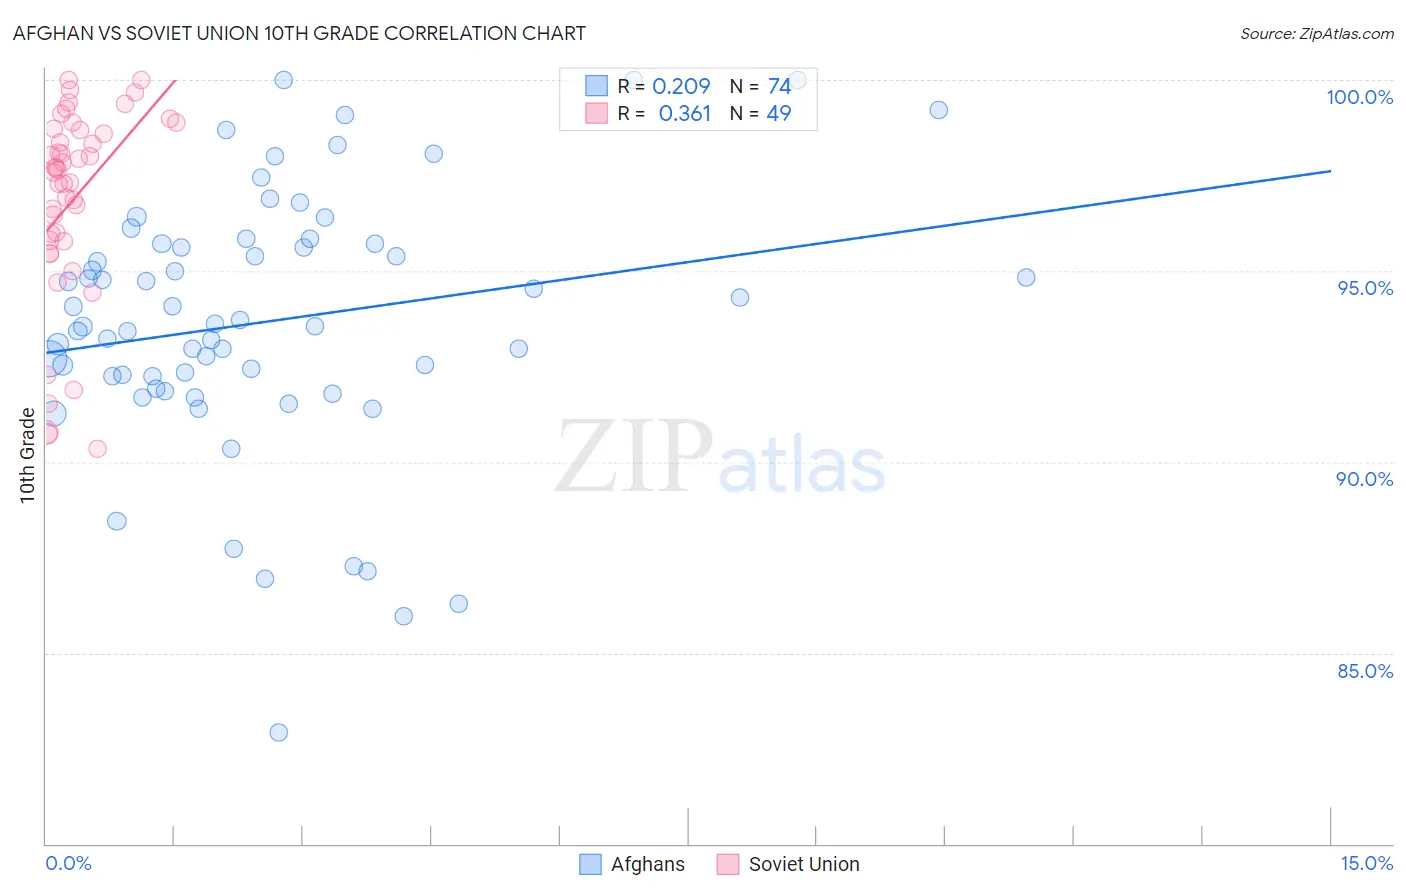
Afghan vs Soviet Union 10th Grade Correlation Chart
The statistical analysis conducted on geographies consisting of 148,851,685 people shows a weak positive correlation between the proportion of Afghans and percentage of population with at least 10th grade education in the United States with a correlation coefficient (R) of 0.209 and weighted average of 93.1%. Similarly, the statistical analysis conducted on geographies consisting of 43,454,395 people shows a mild positive correlation between the proportion of Soviet Union and percentage of population with at least 10th grade education in the United States with a correlation coefficient (R) of 0.361 and weighted average of 94.6%, a difference of 1.6%.
10th Grade Correlation Summary
| Measurement | Afghan | Soviet Union |
| Minimum | 82.9% | 90.4% |
| Maximum | 100.0% | 100.0% |
| Range | 17.1% | 9.6% |
| Mean | 93.7% | 96.9% |
| Median | 93.6% | 97.7% |
| Interquartile 25% (IQ1) | 92.2% | 95.8% |
| Interquartile 75% (IQ3) | 95.7% | 98.7% |
| Interquartile Range (IQR) | 3.5% | 2.9% |
| Standard Deviation (Sample) | 3.4% | 2.5% |
| Standard Deviation (Population) | 3.4% | 2.5% |
Similar Demographics by 10th Grade
Demographics Similar to Afghans by 10th Grade
In terms of 10th grade, the demographic groups most similar to Afghans are African (93.1%, a difference of 0.0%), Subsaharan African (93.1%, a difference of 0.010%), Immigrants from Panama (93.1%, a difference of 0.010%), Immigrants from Africa (93.1%, a difference of 0.020%), and South American Indian (93.1%, a difference of 0.020%).
| Demographics | Rating | Rank | 10th Grade |
| Immigrants | Ethiopia | 5.1 /100 | #229 | Tragic 93.1% |
| Immigrants | Africa | 5.0 /100 | #230 | Tragic 93.1% |
| South American Indians | 4.9 /100 | #231 | Tragic 93.1% |
| Bahamians | 4.9 /100 | #232 | Tragic 93.1% |
| Comanche | 4.9 /100 | #233 | Tragic 93.1% |
| Sub-Saharan Africans | 4.7 /100 | #234 | Tragic 93.1% |
| Africans | 4.6 /100 | #235 | Tragic 93.1% |
| Afghans | 4.5 /100 | #236 | Tragic 93.1% |
| Immigrants | Panama | 4.3 /100 | #237 | Tragic 93.1% |
| Nigerians | 4.2 /100 | #238 | Tragic 93.1% |
| Costa Ricans | 4.2 /100 | #239 | Tragic 93.1% |
| Immigrants | Hong Kong | 4.2 /100 | #240 | Tragic 93.1% |
| Immigrants | Somalia | 2.7 /100 | #241 | Tragic 93.0% |
| Immigrants | Cameroon | 2.6 /100 | #242 | Tragic 93.0% |
| Senegalese | 2.4 /100 | #243 | Tragic 93.0% |
Demographics Similar to Soviet Union by 10th Grade
In terms of 10th grade, the demographic groups most similar to Soviet Union are Immigrants from Germany (94.6%, a difference of 0.0%), Yugoslavian (94.6%, a difference of 0.010%), Menominee (94.6%, a difference of 0.010%), Immigrants from Switzerland (94.6%, a difference of 0.010%), and Lebanese (94.6%, a difference of 0.010%).
| Demographics | Rating | Rank | 10th Grade |
| Puget Sound Salish | 99.0 /100 | #86 | Exceptional 94.7% |
| Immigrants | Saudi Arabia | 99.0 /100 | #87 | Exceptional 94.7% |
| Immigrants | Japan | 99.0 /100 | #88 | Exceptional 94.7% |
| Immigrants | Moldova | 98.9 /100 | #89 | Exceptional 94.7% |
| South Africans | 98.8 /100 | #90 | Exceptional 94.7% |
| Whites/Caucasians | 98.8 /100 | #91 | Exceptional 94.7% |
| Yugoslavians | 98.4 /100 | #92 | Exceptional 94.6% |
| Soviet Union | 98.3 /100 | #93 | Exceptional 94.6% |
| Immigrants | Germany | 98.3 /100 | #94 | Exceptional 94.6% |
| Menominee | 98.3 /100 | #95 | Exceptional 94.6% |
| Immigrants | Switzerland | 98.3 /100 | #96 | Exceptional 94.6% |
| Lebanese | 98.3 /100 | #97 | Exceptional 94.6% |
| Immigrants | Bulgaria | 98.1 /100 | #98 | Exceptional 94.6% |
| Immigrants | France | 97.9 /100 | #99 | Exceptional 94.5% |
| Immigrants | South Central Asia | 97.8 /100 | #100 | Exceptional 94.5% |