Zip Codes with the Highest Percentage of Population Taking Taxi / Cab to Work in Springfield, OR
RELATED REPORTS & OPTIONS
Taxi / Cab
Springfield
Compare Zip Codes
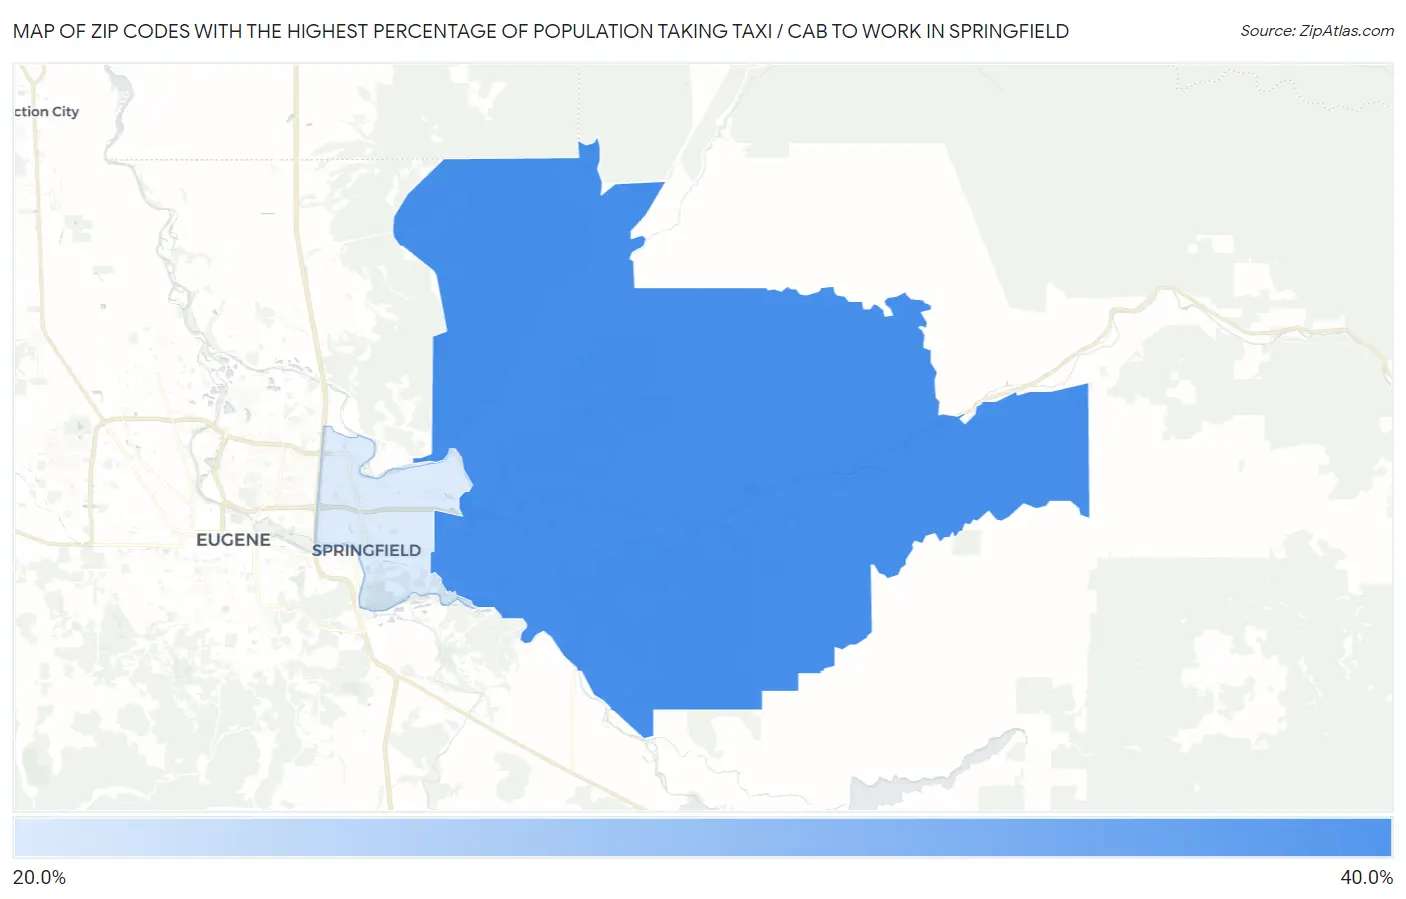
Map of Zip Codes with the Highest Percentage of Population Taking Taxi / Cab to Work in Springfield
29.4%
35.8%
Zip Codes with the Highest Percentage of Population Taking Taxi / Cab to Work in Springfield, OR
| Zip Code | % Take Taxi / Cab | vs State | vs National | |
| 1. | 97478 | 35.8% | 38.0%(-2.20)#105 | 38.2%(-2.40)#8,510 |
| 2. | 97477 | 29.4% | 38.0%(-8.60)#141 | 38.2%(-8.80)#11,138 |
1
Common Questions
What are the Top Zip Codes with the Highest Percentage of Population Taking Taxi / Cab to Work in Springfield, OR?
Top Zip Codes with the Highest Percentage of Population Taking Taxi / Cab to Work in Springfield, OR are:
What zip code has the Highest Percentage of Population Taking Taxi / Cab to Work in Springfield, OR?
97478 has the Highest Percentage of Population Taking Taxi / Cab to Work in Springfield, OR with 35.8%.
What is the Percentage of Population Taking Taxi / Cab to Work in Springfield, OR?
Percentage of Population Taking Taxi / Cab to Work in Springfield is 34.8%.
What is the Percentage of Population Taking Taxi / Cab to Work in Oregon?
Percentage of Population Taking Taxi / Cab to Work in Oregon is 38.0%.
What is the Percentage of Population Taking Taxi / Cab to Work in the United States?
Percentage of Population Taking Taxi / Cab to Work in the United States is 38.2%.