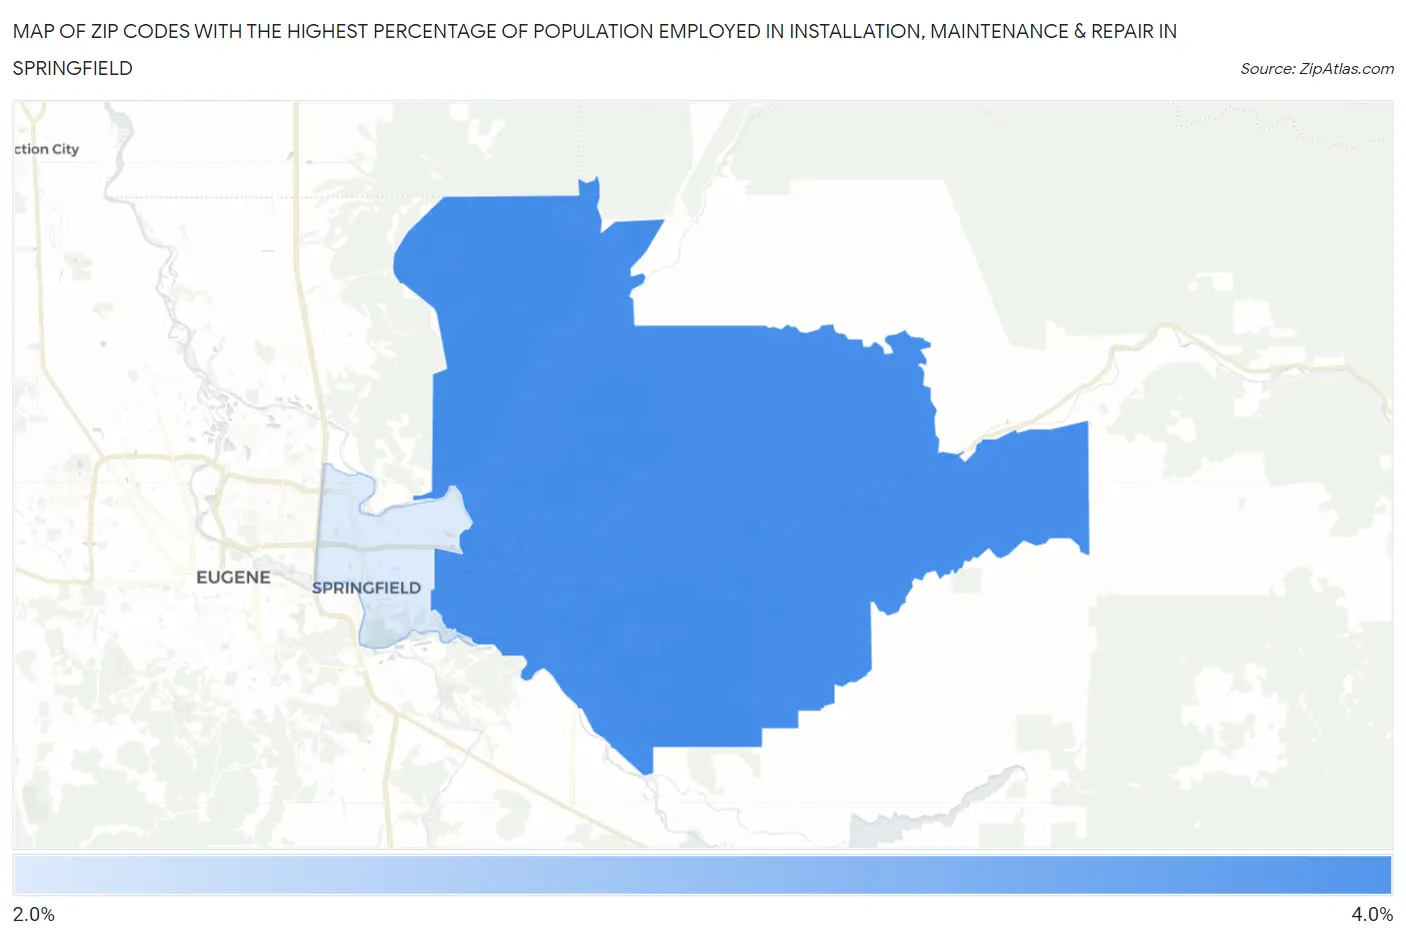
Zip Codes with the Highest Percentage of Population Employed in Installation, Maintenance & Repair in Springfield, OR
RELATED REPORTS & OPTIONS
Installation, Maintenance & Repair
Springfield
Compare Zip Codes
Map of Zip Codes with the Highest Percentage of Population Employed in Installation, Maintenance & Repair in Springfield
2.3%
3.6%
Zip Codes with the Highest Percentage of Population Employed in Installation, Maintenance & Repair in Springfield, OR
| Zip Code | % Employed | vs State | vs National | |
| 1. | 97478 | 3.6% | 2.7%(+0.909)#126 | 3.1%(+0.555)#14,058 |
| 2. | 97477 | 2.3% | 2.7%(-0.396)#216 | 3.1%(-0.750)#20,494 |
1
Common Questions
What are the Top Zip Codes with the Highest Percentage of Population Employed in Installation, Maintenance & Repair in Springfield, OR?
Top Zip Codes with the Highest Percentage of Population Employed in Installation, Maintenance & Repair in Springfield, OR are:
What zip code has the Highest Percentage of Population Employed in Installation, Maintenance & Repair in Springfield, OR?
97478 has the Highest Percentage of Population Employed in Installation, Maintenance & Repair in Springfield, OR with 3.6%.
What is the Percentage of Population Employed in Installation, Maintenance & Repair in Springfield, OR?
Percentage of Population Employed in Installation, Maintenance & Repair in Springfield is 2.8%.
What is the Percentage of Population Employed in Installation, Maintenance & Repair in Oregon?
Percentage of Population Employed in Installation, Maintenance & Repair in Oregon is 2.7%.
What is the Percentage of Population Employed in Installation, Maintenance & Repair in the United States?
Percentage of Population Employed in Installation, Maintenance & Repair in the United States is 3.1%.