Zip Codes with the Highest Percentage of Households Without a Vehicle in Steubenville, OH
RELATED REPORTS & OPTIONS
Households without a Cars
Steubenville
Compare Zip Codes
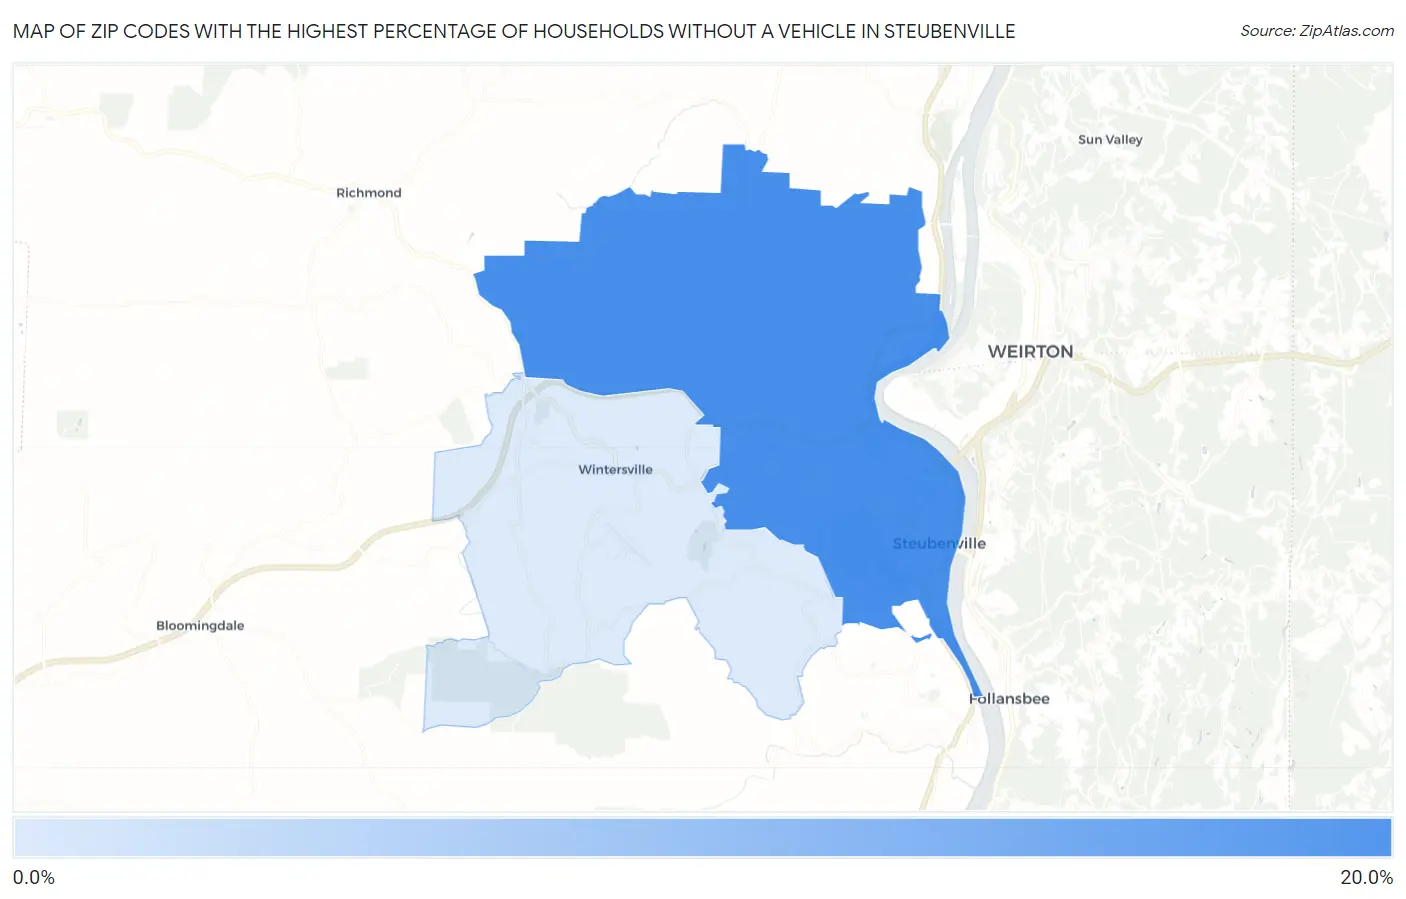
Map of Zip Codes with the Highest Percentage of Households Without a Vehicle in Steubenville
3.7%
17.1%
Zip Codes with the Highest Percentage of Households Without a Vehicle in Steubenville, OH
| Zip Code | Housholds Without a Car | vs State | vs National | |
| 1. | 43952 | 17.1% | 7.4%(+9.70)#85 | 8.3%(+8.80)#1,936 |
| 2. | 43953 | 3.7% | 7.4%(-3.70)#668 | 8.3%(-4.60)#16,741 |
1
Common Questions
What are the Top Zip Codes with the Highest Percentage of Households Without a Vehicle in Steubenville, OH?
Top Zip Codes with the Highest Percentage of Households Without a Vehicle in Steubenville, OH are:
What zip code has the Highest Percentage of Households Without a Vehicle in Steubenville, OH?
43952 has the Highest Percentage of Households Without a Vehicle in Steubenville, OH with 17.1%.
What is the Percentage of Households Without a Vehicle in Steubenville, OH?
Percentage of Households Without a Vehicle in Steubenville is 16.2%.
What is the Percentage of Households Without a Vehicle in Ohio?
Percentage of Households Without a Vehicle in Ohio is 7.4%.
What is the Percentage of Households Without a Vehicle in the United States?
Percentage of Households Without a Vehicle in the United States is 8.3%.