Zip Codes with the Highest Inequality / Gini Index in Long Island City, NY
On this page
RELATED REPORTS & OPTIONS
Highest Inequality / Gini Index
Population
Highest PopulationHighest Population DensityLowest Population DensityMale / Female RatioFemale / Male RatioOldest PopulationOldest Population | MaleOldest Population | FemaleYoungest PopulationYoungest Population | MaleYoungest Population | Female
Families and Households
Largest Family SizeLargest Household SizeMost Single MothersFewest Single MothersSmallest Family SizeSmallest Household Size
Female Fertility
Highest Birth Rate | All WomenHighest Birth Rate | Women 35+Highest Birth Rate | Below PovertyHighest Birth Rate | Public IncomeHighest Birth Rate | In Labor ForceLowest Birth Rate | All WomenLowest Birth Rate | Women 35+Lowest Birth Rate | Below PovertyLowest Birth Rate | Public IncomeLowest Birth Rate | In Labor Force
Race (Community Size)
Race (Percentage)
Ancestry (Community Size)
AmericanArabAustralianAustrianBelgianBhutaneseBrazilianBritishBurmeseColombianCubanCzechDanishDominicanDutchEastern EuropeanEcuadorianEnglishEuropeanFilipinoFrenchFrench CanadianGermanGreekHungarianIndian (Asian)IranianIrishIsraeliItalianLebaneseLithuanianMexicanNorwegianPolishPortuguesePuerto RicanRussianScottishSerbianSlovakSloveneSouth AmericanSpaniardSwedishThaiUkrainianVenezuelanVietnamese
Ancestry (Percentage)
AmericanArabAustralianAustrianBelgianBhutaneseBrazilianBritishBurmeseColombianCubanCzechDanishDominicanDutchEastern EuropeanEcuadorianEnglishEuropeanFilipinoFrenchFrench CanadianGermanGreekHungarianIndian (Asian)IranianIrishIsraeliItalianLebaneseLithuanianMexicanNorwegianPolishPortuguesePuerto RicanRussianScottishSerbianSlovakSloveneSouth AmericanSpaniardSwedishThaiUkrainianVenezuelanVietnamese
Immigrant Origin (Total)
AsiaAustraliaBangladeshBrazilCaribbeanCentral AmericaChinaColombiaCubaEastern AsiaEastern EuropeEcuadorEnglandEuropeGermanyGreeceHong KongIndiaIsraelItalyJapanKoreaLatin AmericaMexicoNorthern EuropeOceaniaPolandRussiaSerbiaSouth AmericaSouth Central AsiaSouthern EuropeSpainTaiwanUkraineVenezuelaWestern AsiaWestern Europe
Immigrant Origin (Percentage)
AsiaAustraliaBangladeshBrazilCaribbeanCentral AmericaChinaColombiaCubaEastern AsiaEastern EuropeEcuadorEnglandEuropeGermanyGreeceHong KongIndiaIsraelItalyJapanKoreaLatin AmericaMexicoNorthern EuropeOceaniaPolandRussiaSerbiaSouth AmericaSouth Central AsiaSouthern EuropeSpainTaiwanUkraineVenezuelaWestern AsiaWestern Europe
Income
Highest Per Capita IncomeHighest Earnings | MaleHighest Earnings | FemaleHighest Wage/Income Gap ($)Highest Wage/Income Gap (%)Highest Inequality / Gini IndexLowest Per Capita IncomeLowest Earnings | MaleLowest Earnings | FemaleLowest Wage/Income Gap ($)Lowest Wage/Income Gap (%)Lowest Inequality / Gini Index
Income (Families)
Income (Households)
Poverty
Highest PovertyHighest Poverty | MaleHighest Poverty | FemaleHighest Poverty | Female 25-34Lowest PovertyLowest Poverty | MaleLowest Poverty | Female
Unemployment
Highest UnemploymentHighest Unemployment | MaleHighest Unemployment | FemaleLowest UnemploymentLowest Unemployment | MaleLowest Unemployment | Female
Employment Occupations
Architecture & EngineeringArts, Media & EntertainmentBusiness & FinancialCleaning & MaintenanceCommunity & Social Service Computer & MathematicsComputer, Engineering & ScienceConstruction & ExtractionEducation Instruction & LibraryEducation, Arts & MediaFood Preparation & ServingHealth Diagnosing & TreatingHealth TechnologistsLegal Services & SupportLife, Physical & Social ScienceManagementMaterial MovingOffice & AdministrationPersonal Care and ServiceProductionSales & RelatedTransportation
Employment Industries
Accommodation & Food ServicesArts, Entertainment & RecreationConstructionEducational ServicesEnterprise ManagementFinance & InsuranceHealth Care & Social AssistanceInformation & TechnologyManufacturingProfessional & Scientific ServicesPublic AdministrationReal Estate, Rental & LeasingRetail TradeTransportation & WarehousingWholesale Trade
Employer Class
Private Company EmployeesSelf-Employed / IncorporatedSelf-Employed / Not IncorporatedNot-for-profit OrganizationsLocal Government EmployeesState Government EmployeesFederal Government Employees
Commute Time
Longest CommuteLongest Commute | MaleLongest Commute | FemaleShortest CommuteShortest Commute | MaleShortest Commute | Female
Commute Means
School Enrollment
Education by Degree Field
Computers and MathematicsBio, Nature & AgriculturalPhysical and Health SciencesPsychologySocial SciencesEngineeringMultidisciplinary StudiesScience and EngineeringBusinessEducationLiterature and LanguagesLiberal Arts and HistoryVisual and Performing ArtsCommunicationsArts and Humanities
Occupancy
Finances
Highest Median Housing CostsHighest Owner Housing CostsHighest Renter Housing CostsHighest Housing Costs / IncomeLowest Median Housing CostsLowest Owner Housing CostsLowest Renter Housing CostsLowest Housing Costs / Income
Physical Characteristics
Long Island City
States
AlabamaAlaskaArizonaArkansasCaliforniaColoradoConnecticutDelawareDistrict Of ColumbiaFloridaGeorgiaHawaiiIdahoIllinoisIndianaIowaKansasKentuckyLouisianaMaineMarylandMassachusettsMichiganMinnesotaMississippiMissouriMontanaNebraskaNevadaNew HampshireNew JerseyNew MexicoNew YorkNorth CarolinaNorth DakotaOhioOklahomaOregonPennsylvaniaPuerto RicoRhode IslandSouth CarolinaSouth DakotaTennesseeTexasUtahVermontVirginiaWashingtonWest VirginiaWisconsinWyoming
New York Cities
AlbanyAstoriaBaysideBinghamtonBronxBrooklynBuffaloEast ElmhurstElmiraFar RockawayFloral ParkFlushingFresh MeadowsGreat NeckJamaicaKeesevilleLittle NeckLiverpoolLong Island CityLyon MountainMiddletownMount VernonNew RochelleNew YorkNiagara FallsOzone ParkPlattsburghPoughkeepsieQueens VillageRochesterRomeSchenectadyStaten IslandStephentownSyracuseTroyUticaValley StreamWatertownWhite PlainsYonkers
Compare Zip Codes
Comparison Subject
Compare StatesCompare CitiesCompare Zip Codes
Map of Zip Codes with the Highest Inequality / Gini Index in Long Island City
0.41
0.50
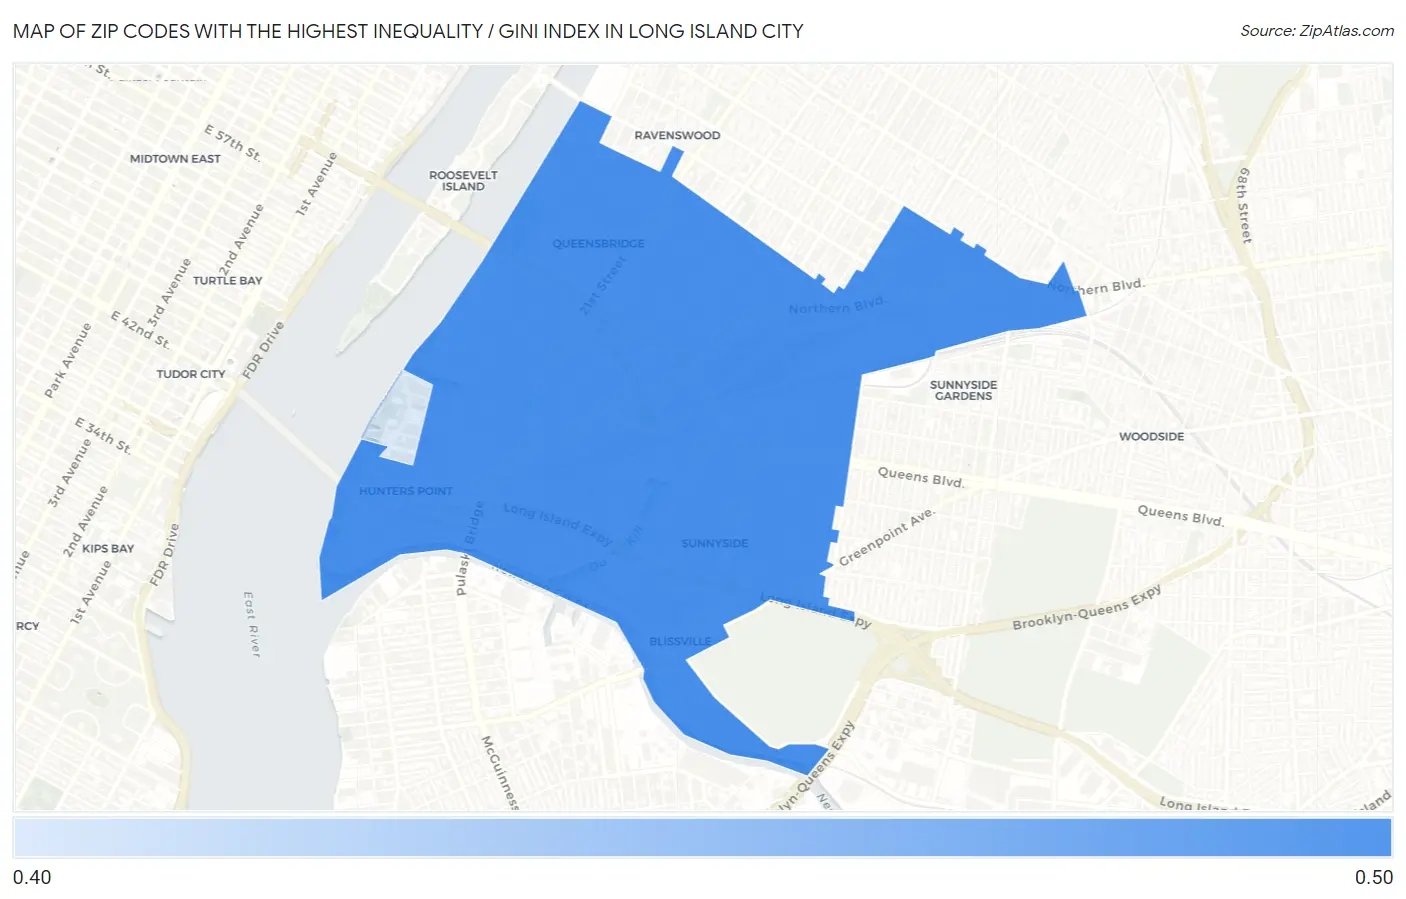
Zip Codes with the Highest Inequality / Gini Index in Long Island City, NY
| Zip Code | Inequality / Gini Index | vs State | vs National | |
| 1. | 11101 | 0.50 | 0.51(-0.018)#251 | 0.48(+0.014)#3,749 |
| 2. | 11109 | 0.41 | 0.51(-0.102)#945 | 0.48(-0.071)#17,136 |
1
Common Questions
What are the Top Zip Codes with the Highest Inequality / Gini Index in Long Island City, NY?
Top Zip Codes with the Highest Inequality / Gini Index in Long Island City, NY are:
What zip code has the Highest Inequality / Gini Index in Long Island City, NY?
11101 has the Highest Inequality / Gini Index in Long Island City, NY with 0.50.
What is the Inequality / Gini Index in New York?
Inequality / Gini Index in New York is 0.51.
What is the Inequality / Gini Index in the United States?
Inequality / Gini Index in the United States is 0.48.