Zip Codes with the Lowest Costs of Housing as Percentage of Income in Long Island City, NY
RELATED REPORTS & OPTIONS
Lowest Housing Costs / Income
Long Island City
Compare Zip Codes
Map of Zip Codes with the Lowest Costs of Housing as Percentage of Income in Long Island City
28.4%
26.5%
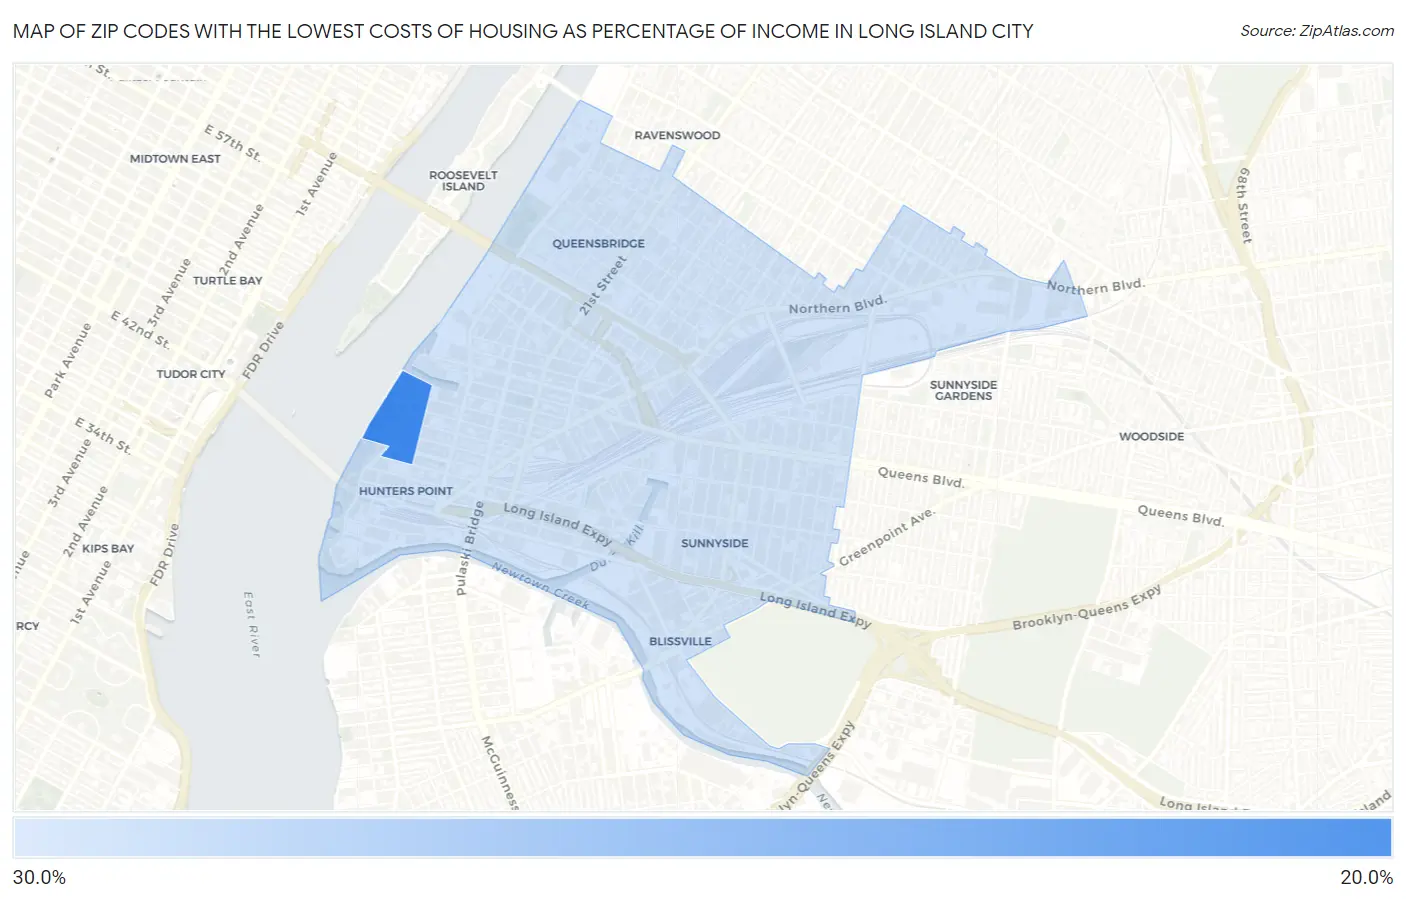
Zip Codes with the Lowest Costs of Housing as Percentage of Income in Long Island City, NY
| Zip Code | Housing Costs / Income | vs State | vs National | |
| 1. | 11109 | 26.5% | 23.0%(+3.51)#1,432 | 20.4%(+6.10)#27,902 |
| 2. | 11101 | 28.4% | 23.0%(+5.48)#1,487 | 20.4%(+8.06)#28,662 |
1
Common Questions
What are the Top Zip Codes with the Lowest Costs of Housing as Percentage of Income in Long Island City, NY?
Top Zip Codes with the Lowest Costs of Housing as Percentage of Income in Long Island City, NY are:
What zip code has the Lowest Costs of Housing as Percentage of Income in Long Island City, NY?
11109 has the Lowest Costs of Housing as Percentage of Income in Long Island City, NY with 26.5%.
What is the Average Housing Costs as Percentage of Income in New York?
Average Housing Costs as Percentage of Income in New York is 23.0%.
What is the Average Housing Costs as Percentage of Income in the United States?
Average Housing Costs as Percentage of Income in the United States is 20.4%.