Zip Codes with the Highest Percentage of Households With One or more Vehicles in Long Island City, NY
RELATED REPORTS & OPTIONS
Households with 1 or more Cars
Long Island City
Compare Zip Codes
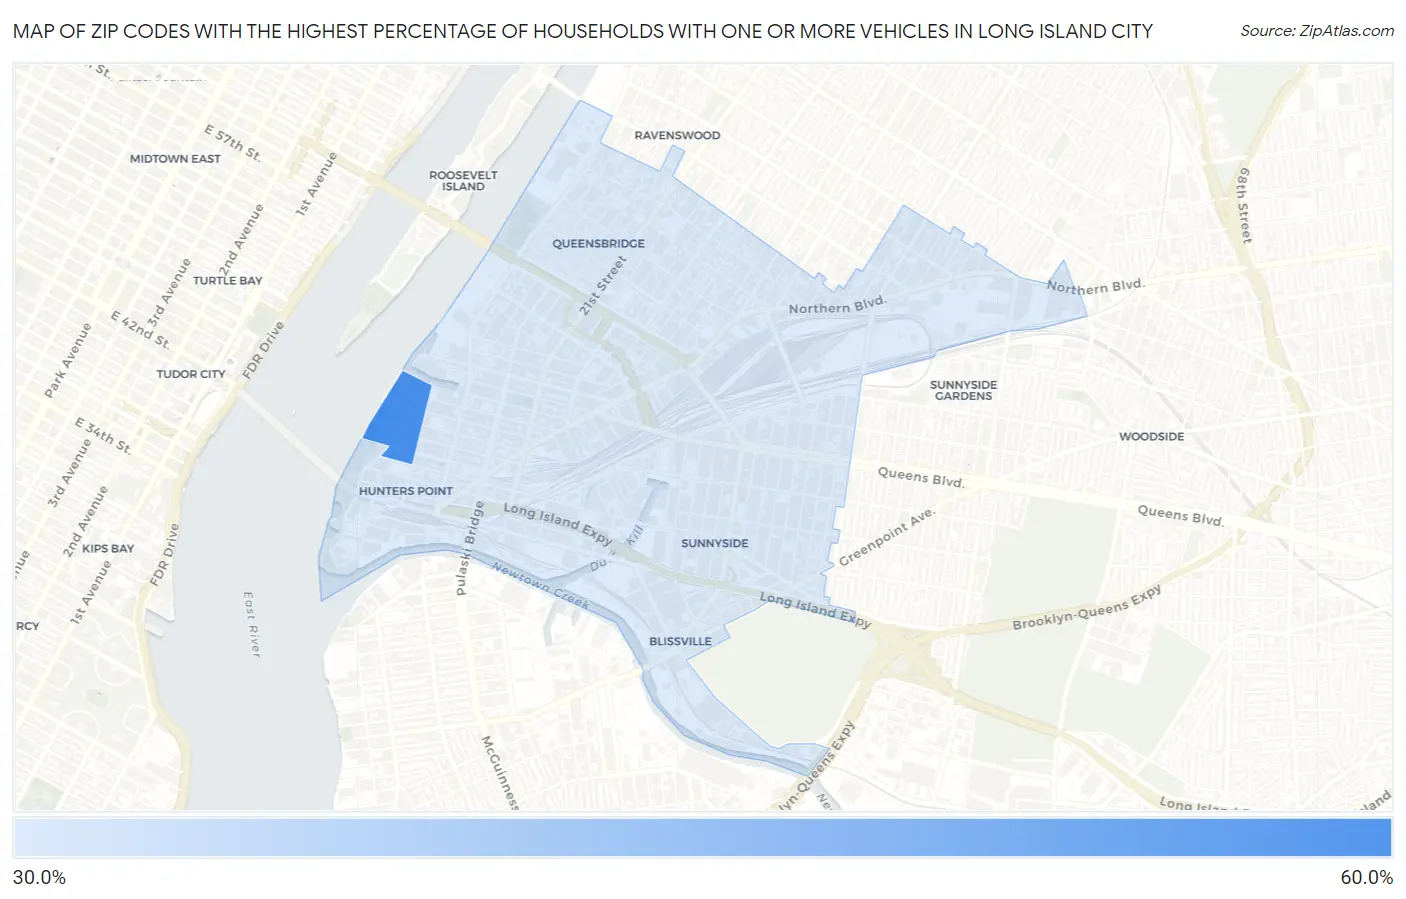
Map of Zip Codes with the Highest Percentage of Households With One or more Vehicles in Long Island City
31.9%
53.3%
Zip Codes with the Highest Percentage of Households With One or more Vehicles in Long Island City, NY
| Zip Code | Housholds With 1+ Cars | vs State | vs National | |
| 1. | 11109 | 53.3% | 71.1%(-17.8)#1,645 | 91.7%(-38.4)#32,436 |
| 2. | 11101 | 31.9% | 71.1%(-39.2)#1,692 | 91.7%(-59.8)#32,610 |
1
Common Questions
What are the Top Zip Codes with the Highest Percentage of Households With One or more Vehicles in Long Island City, NY?
Top Zip Codes with the Highest Percentage of Households With One or more Vehicles in Long Island City, NY are:
What zip code has the Highest Percentage of Households With One or more Vehicles in Long Island City, NY?
11109 has the Highest Percentage of Households With One or more Vehicles in Long Island City, NY with 53.3%.
What is the Percentage of Households With One or more Vehicles in New York?
Percentage of Households With One or more Vehicles in New York is 71.1%.
What is the Percentage of Households With One or more Vehicles in the United States?
Percentage of Households With One or more Vehicles in the United States is 91.7%.