Zip Codes with the Highest Percentage of Households Heated by Utility Gas in Long Island City, NY
RELATED REPORTS & OPTIONS
Utility Gas Heating
Long Island City
Compare Zip Codes
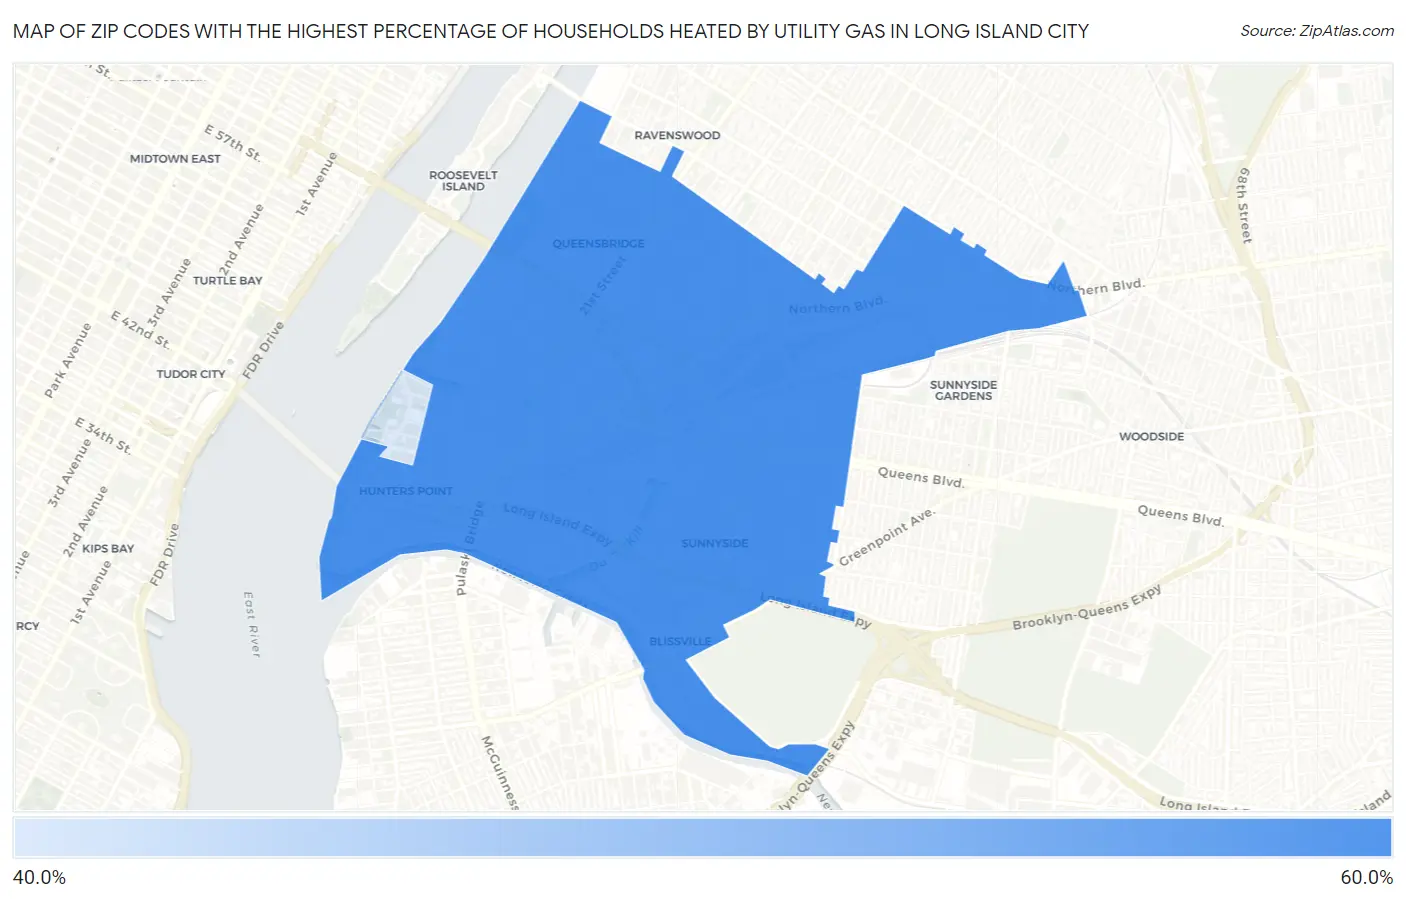
Map of Zip Codes with the Highest Percentage of Households Heated by Utility Gas in Long Island City
43.8%
57.7%
Zip Codes with the Highest Percentage of Households Heated by Utility Gas in Long Island City, NY
| Zip Code | Utility Gas Heating | vs State | vs National | |
| 1. | 11101 | 57.7% | 59.4%(-1.70)#560 | 47.1%(+10.6)#8,041 |
| 2. | 11109 | 43.8% | 59.4%(-15.6)#773 | 47.1%(-3.30)#12,020 |
1
Common Questions
What are the Top Zip Codes with the Highest Percentage of Households Heated by Utility Gas in Long Island City, NY?
Top Zip Codes with the Highest Percentage of Households Heated by Utility Gas in Long Island City, NY are:
What zip code has the Highest Percentage of Households Heated by Utility Gas in Long Island City, NY?
11101 has the Highest Percentage of Households Heated by Utility Gas in Long Island City, NY with 57.7%.
What is the Percentage of Households Heated by Utility Gas in New York?
Percentage of Households Heated by Utility Gas in New York is 59.4%.
What is the Percentage of Households Heated by Utility Gas in the United States?
Percentage of Households Heated by Utility Gas in the United States is 47.1%.