Zip Codes with the Highest Percentage of Population Employed in Manufacturing in Camden, NJ
RELATED REPORTS & OPTIONS
Manufacturing
Camden
Compare Zip Codes
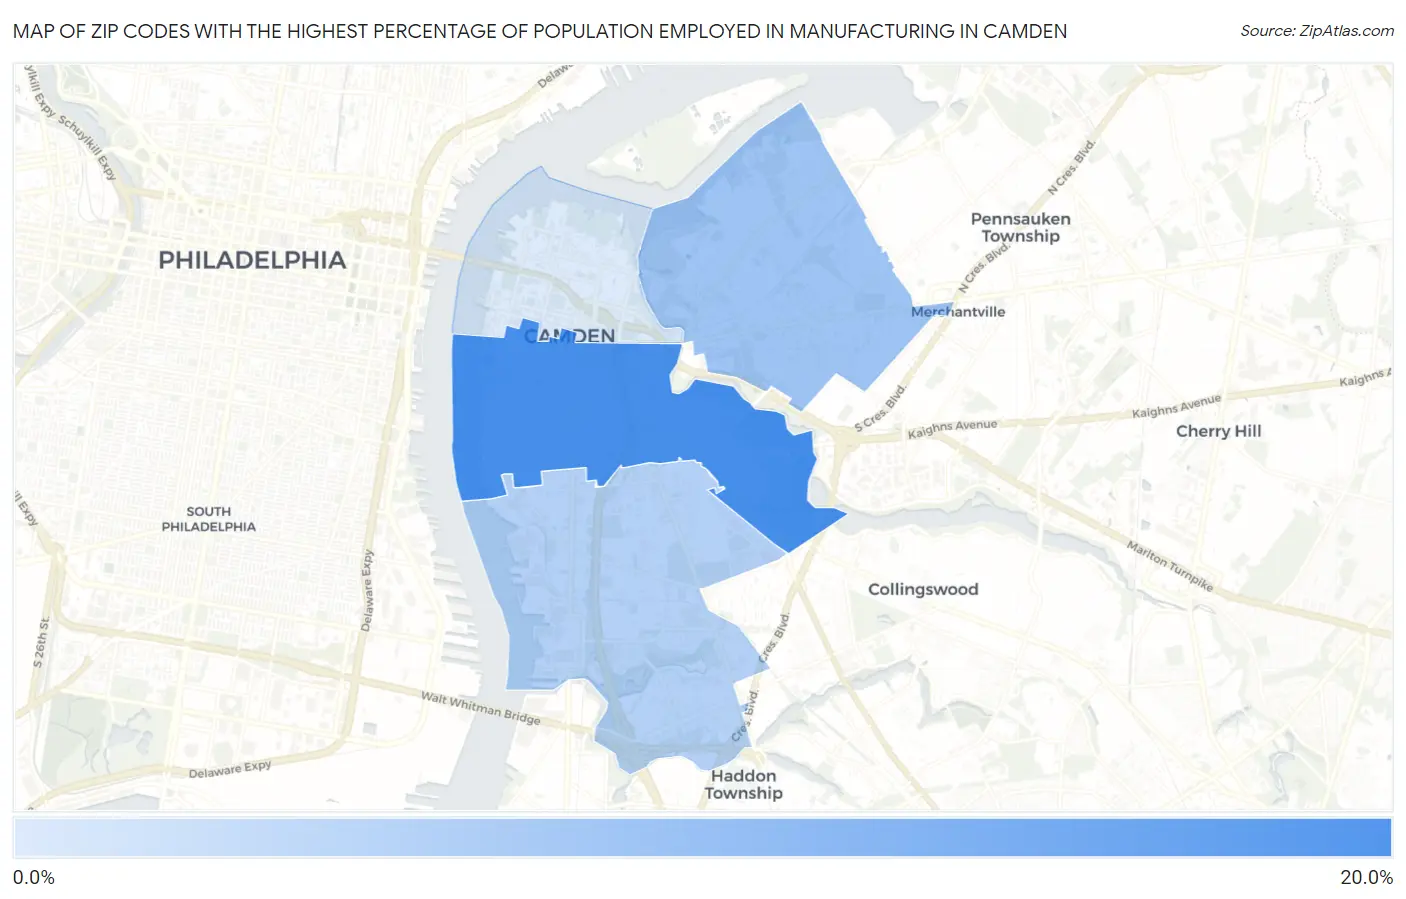
Map of Zip Codes with the Highest Percentage of Population Employed in Manufacturing in Camden
5.8%
16.5%
Zip Codes with the Highest Percentage of Population Employed in Manufacturing in Camden, NJ
| Zip Code | % Employed | vs State | vs National | |
| 1. | 08103 | 16.5% | 8.1%(+8.41)#20 | 10.0%(+6.52)#7,546 |
| 2. | 08105 | 10.1% | 8.1%(+1.97)#145 | 10.0%(+0.085)#15,645 |
| 3. | 08104 | 8.6% | 8.1%(+0.513)#227 | 10.0%(-1.37)#18,083 |
| 4. | 08102 | 5.8% | 8.1%(-2.30)#424 | 10.0%(-4.19)#23,113 |
1
Common Questions
What are the Top 3 Zip Codes with the Highest Percentage of Population Employed in Manufacturing in Camden, NJ?
Top 3 Zip Codes with the Highest Percentage of Population Employed in Manufacturing in Camden, NJ are:
What zip code has the Highest Percentage of Population Employed in Manufacturing in Camden, NJ?
08103 has the Highest Percentage of Population Employed in Manufacturing in Camden, NJ with 16.5%.
What is the Percentage of Population Employed in Manufacturing in Camden, NJ?
Percentage of Population Employed in Manufacturing in Camden is 10.7%.
What is the Percentage of Population Employed in Manufacturing in New Jersey?
Percentage of Population Employed in Manufacturing in New Jersey is 8.1%.
What is the Percentage of Population Employed in Manufacturing in the United States?
Percentage of Population Employed in Manufacturing in the United States is 10.0%.