Immigrants from Croatia vs African In Labor Force | Age > 16
COMPARE
Immigrants from Croatia
African
In Labor Force | Age > 16
In Labor Force | Age > 16 Comparison
Immigrants from Croatia
Africans
65.0%
IN LABOR FORCE | AGE > 16
35.7/ 100
METRIC RATING
187th/ 347
METRIC RANK
64.6%
IN LABOR FORCE | AGE > 16
5.8/ 100
METRIC RATING
232nd/ 347
METRIC RANK
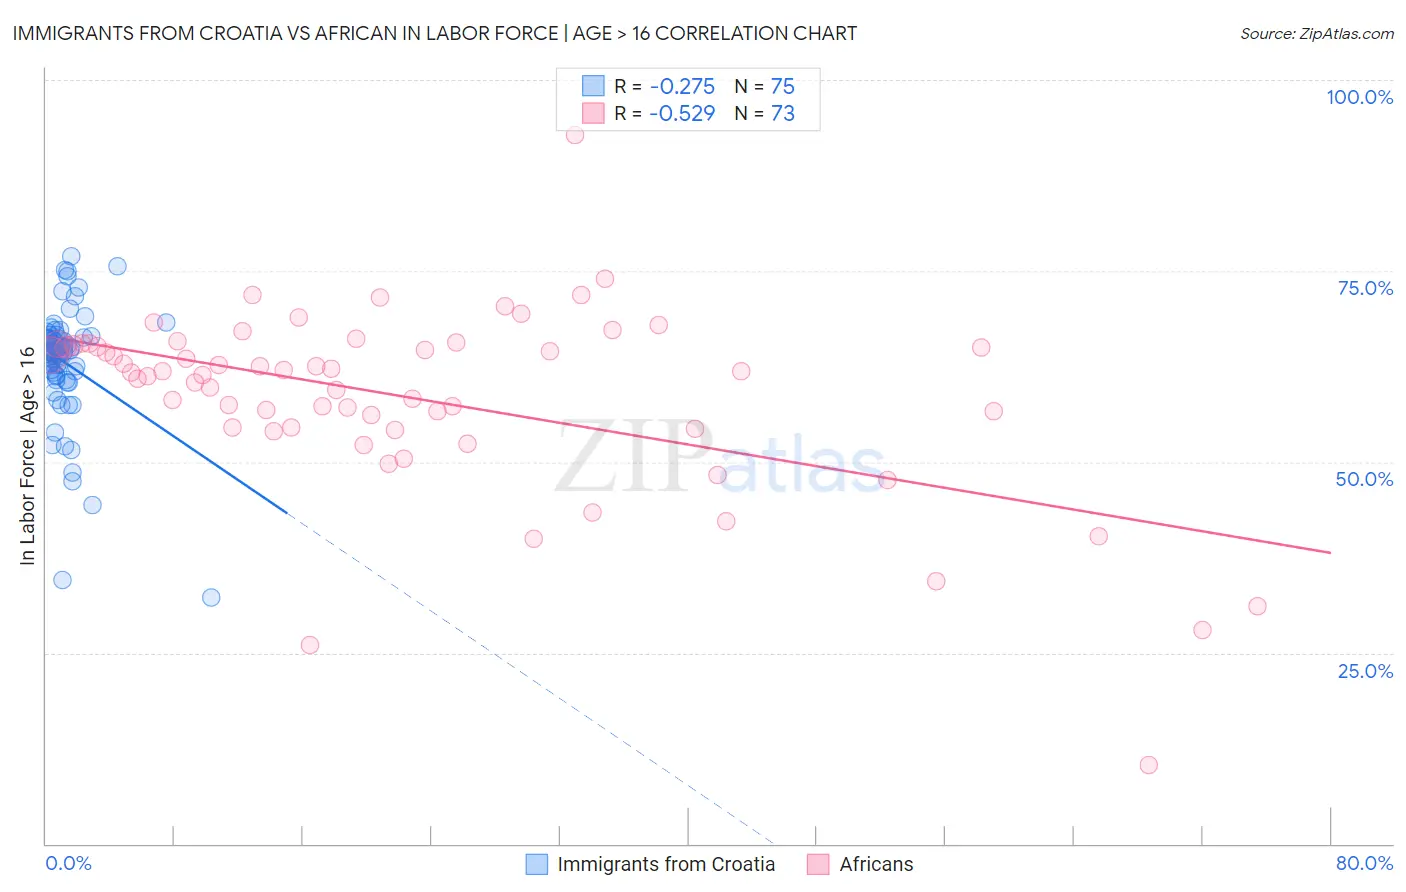
Immigrants from Croatia vs African In Labor Force | Age > 16 Correlation Chart
The statistical analysis conducted on geographies consisting of 132,563,331 people shows a weak negative correlation between the proportion of Immigrants from Croatia and labor force participation rate among population ages 16 and over in the United States with a correlation coefficient (R) of -0.275 and weighted average of 65.0%. Similarly, the statistical analysis conducted on geographies consisting of 470,091,127 people shows a substantial negative correlation between the proportion of Africans and labor force participation rate among population ages 16 and over in the United States with a correlation coefficient (R) of -0.529 and weighted average of 64.6%, a difference of 0.62%.
In Labor Force | Age > 16 Correlation Summary
| Measurement | Immigrants from Croatia | African |
| Minimum | 32.2% | 10.3% |
| Maximum | 77.0% | 92.8% |
| Range | 44.8% | 82.5% |
| Mean | 63.0% | 58.4% |
| Median | 64.4% | 61.6% |
| Interquartile 25% (IQ1) | 61.3% | 54.4% |
| Interquartile 75% (IQ3) | 66.4% | 65.3% |
| Interquartile Range (IQR) | 5.1% | 10.9% |
| Standard Deviation (Sample) | 7.9% | 12.3% |
| Standard Deviation (Population) | 7.8% | 12.2% |
Similar Demographics by In Labor Force | Age > 16
Demographics Similar to Immigrants from Croatia by In Labor Force | Age > 16
In terms of in labor force | age > 16, the demographic groups most similar to Immigrants from Croatia are Immigrants from Portugal (65.0%, a difference of 0.010%), Immigrants from Greece (65.0%, a difference of 0.020%), Barbadian (65.0%, a difference of 0.020%), Scandinavian (65.0%, a difference of 0.020%), and Immigrants from Switzerland (65.0%, a difference of 0.030%).
| Demographics | Rating | Rank | In Labor Force | Age > 16 |
| Immigrants | Latvia | 42.9 /100 | #180 | Average 65.1% |
| Immigrants | Panama | 42.4 /100 | #181 | Average 65.1% |
| Immigrants | Nicaragua | 41.1 /100 | #182 | Average 65.1% |
| Soviet Union | 40.5 /100 | #183 | Average 65.0% |
| Carpatho Rusyns | 40.0 /100 | #184 | Average 65.0% |
| Syrians | 40.0 /100 | #185 | Average 65.0% |
| Immigrants | Switzerland | 38.2 /100 | #186 | Fair 65.0% |
| Immigrants | Croatia | 35.7 /100 | #187 | Fair 65.0% |
| Immigrants | Portugal | 34.8 /100 | #188 | Fair 65.0% |
| Immigrants | Greece | 34.3 /100 | #189 | Fair 65.0% |
| Barbadians | 33.9 /100 | #190 | Fair 65.0% |
| Scandinavians | 33.7 /100 | #191 | Fair 65.0% |
| Immigrants | Fiji | 33.7 /100 | #192 | Fair 65.0% |
| Immigrants | Europe | 33.6 /100 | #193 | Fair 65.0% |
| Immigrants | Southern Europe | 31.3 /100 | #194 | Fair 65.0% |
Demographics Similar to Africans by In Labor Force | Age > 16
In terms of in labor force | age > 16, the demographic groups most similar to Africans are Slavic (64.6%, a difference of 0.050%), Vietnamese (64.6%, a difference of 0.060%), Austrian (64.6%, a difference of 0.060%), British (64.7%, a difference of 0.070%), and Chinese (64.7%, a difference of 0.070%).
| Demographics | Rating | Rank | In Labor Force | Age > 16 |
| Croatians | 8.8 /100 | #225 | Tragic 64.7% |
| Europeans | 8.3 /100 | #226 | Tragic 64.7% |
| Poles | 8.3 /100 | #227 | Tragic 64.7% |
| Northern Europeans | 8.2 /100 | #228 | Tragic 64.7% |
| British | 7.3 /100 | #229 | Tragic 64.7% |
| Chinese | 7.3 /100 | #230 | Tragic 64.7% |
| Immigrants | Northern Europe | 7.2 /100 | #231 | Tragic 64.7% |
| Africans | 5.8 /100 | #232 | Tragic 64.6% |
| Slavs | 4.9 /100 | #233 | Tragic 64.6% |
| Vietnamese | 4.7 /100 | #234 | Tragic 64.6% |
| Austrians | 4.6 /100 | #235 | Tragic 64.6% |
| Immigrants | Norway | 4.6 /100 | #236 | Tragic 64.6% |
| Italians | 4.6 /100 | #237 | Tragic 64.6% |
| Lebanese | 3.9 /100 | #238 | Tragic 64.5% |
| Immigrants | Hungary | 3.8 /100 | #239 | Tragic 64.5% |