Aleut vs African In Labor Force | Age > 16
COMPARE
Aleut
African
In Labor Force | Age > 16
In Labor Force | Age > 16 Comparison
Aleuts
Africans
66.0%
IN LABOR FORCE | AGE > 16
99.1/ 100
METRIC RATING
92nd/ 347
METRIC RANK
64.6%
IN LABOR FORCE | AGE > 16
5.8/ 100
METRIC RATING
232nd/ 347
METRIC RANK
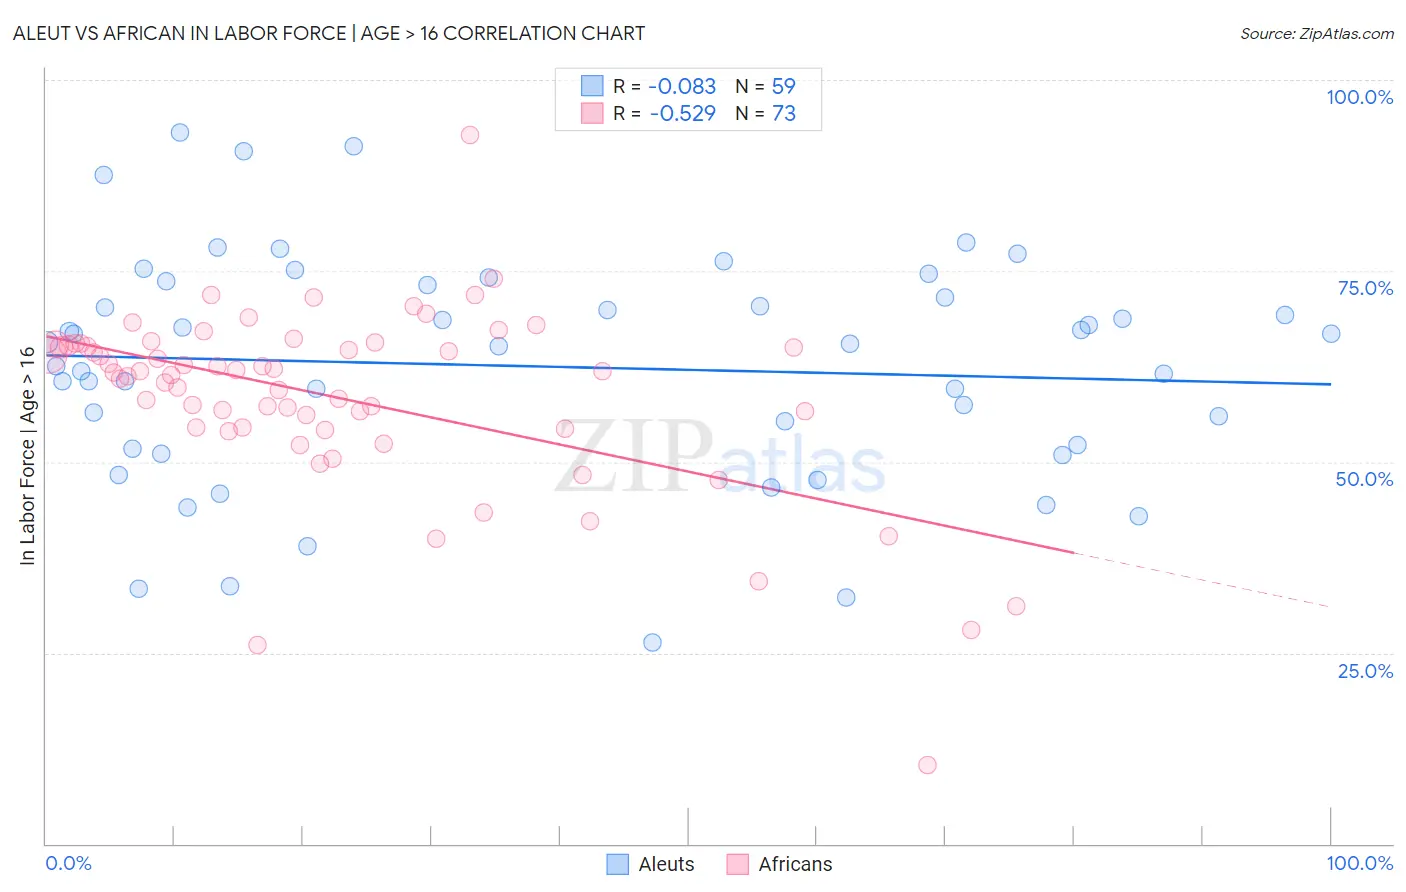
Aleut vs African In Labor Force | Age > 16 Correlation Chart
The statistical analysis conducted on geographies consisting of 61,782,890 people shows a slight negative correlation between the proportion of Aleuts and labor force participation rate among population ages 16 and over in the United States with a correlation coefficient (R) of -0.083 and weighted average of 66.0%. Similarly, the statistical analysis conducted on geographies consisting of 470,091,127 people shows a substantial negative correlation between the proportion of Africans and labor force participation rate among population ages 16 and over in the United States with a correlation coefficient (R) of -0.529 and weighted average of 64.6%, a difference of 2.1%.
In Labor Force | Age > 16 Correlation Summary
| Measurement | Aleut | African |
| Minimum | 26.4% | 10.3% |
| Maximum | 93.1% | 92.8% |
| Range | 66.7% | 82.5% |
| Mean | 62.5% | 58.4% |
| Median | 65.5% | 61.6% |
| Interquartile 25% (IQ1) | 51.7% | 54.4% |
| Interquartile 75% (IQ3) | 73.1% | 65.3% |
| Interquartile Range (IQR) | 21.4% | 10.9% |
| Standard Deviation (Sample) | 14.9% | 12.3% |
| Standard Deviation (Population) | 14.8% | 12.2% |
Similar Demographics by In Labor Force | Age > 16
Demographics Similar to Aleuts by In Labor Force | Age > 16
In terms of in labor force | age > 16, the demographic groups most similar to Aleuts are Immigrants from South America (66.0%, a difference of 0.010%), Iranian (66.0%, a difference of 0.020%), Immigrants from Cambodia (66.0%, a difference of 0.020%), Immigrants from Uruguay (66.0%, a difference of 0.020%), and Immigrants from Laos (66.0%, a difference of 0.030%).
| Demographics | Rating | Rank | In Labor Force | Age > 16 |
| Mongolians | 99.4 /100 | #85 | Exceptional 66.1% |
| South Americans | 99.4 /100 | #86 | Exceptional 66.0% |
| South American Indians | 99.4 /100 | #87 | Exceptional 66.0% |
| Bermudans | 99.3 /100 | #88 | Exceptional 66.0% |
| Immigrants | Laos | 99.2 /100 | #89 | Exceptional 66.0% |
| Chileans | 99.2 /100 | #90 | Exceptional 66.0% |
| Iranians | 99.2 /100 | #91 | Exceptional 66.0% |
| Aleuts | 99.1 /100 | #92 | Exceptional 66.0% |
| Immigrants | South America | 99.1 /100 | #93 | Exceptional 66.0% |
| Immigrants | Cambodia | 99.1 /100 | #94 | Exceptional 66.0% |
| Immigrants | Uruguay | 99.1 /100 | #95 | Exceptional 66.0% |
| Bangladeshis | 98.9 /100 | #96 | Exceptional 65.9% |
| Filipinos | 98.9 /100 | #97 | Exceptional 65.9% |
| Immigrants | Chile | 98.7 /100 | #98 | Exceptional 65.9% |
| Immigrants | Australia | 98.7 /100 | #99 | Exceptional 65.9% |
Demographics Similar to Africans by In Labor Force | Age > 16
In terms of in labor force | age > 16, the demographic groups most similar to Africans are Slavic (64.6%, a difference of 0.050%), Vietnamese (64.6%, a difference of 0.060%), Austrian (64.6%, a difference of 0.060%), British (64.7%, a difference of 0.070%), and Chinese (64.7%, a difference of 0.070%).
| Demographics | Rating | Rank | In Labor Force | Age > 16 |
| Croatians | 8.8 /100 | #225 | Tragic 64.7% |
| Europeans | 8.3 /100 | #226 | Tragic 64.7% |
| Poles | 8.3 /100 | #227 | Tragic 64.7% |
| Northern Europeans | 8.2 /100 | #228 | Tragic 64.7% |
| British | 7.3 /100 | #229 | Tragic 64.7% |
| Chinese | 7.3 /100 | #230 | Tragic 64.7% |
| Immigrants | Northern Europe | 7.2 /100 | #231 | Tragic 64.7% |
| Africans | 5.8 /100 | #232 | Tragic 64.6% |
| Slavs | 4.9 /100 | #233 | Tragic 64.6% |
| Vietnamese | 4.7 /100 | #234 | Tragic 64.6% |
| Austrians | 4.6 /100 | #235 | Tragic 64.6% |
| Immigrants | Norway | 4.6 /100 | #236 | Tragic 64.6% |
| Italians | 4.6 /100 | #237 | Tragic 64.6% |
| Lebanese | 3.9 /100 | #238 | Tragic 64.5% |
| Immigrants | Hungary | 3.8 /100 | #239 | Tragic 64.5% |