Vietnamese vs African In Labor Force | Age > 16
COMPARE
Vietnamese
African
In Labor Force | Age > 16
In Labor Force | Age > 16 Comparison
Vietnamese
Africans
64.6%
IN LABOR FORCE | AGE > 16
4.7/ 100
METRIC RATING
234th/ 347
METRIC RANK
64.6%
IN LABOR FORCE | AGE > 16
5.8/ 100
METRIC RATING
232nd/ 347
METRIC RANK
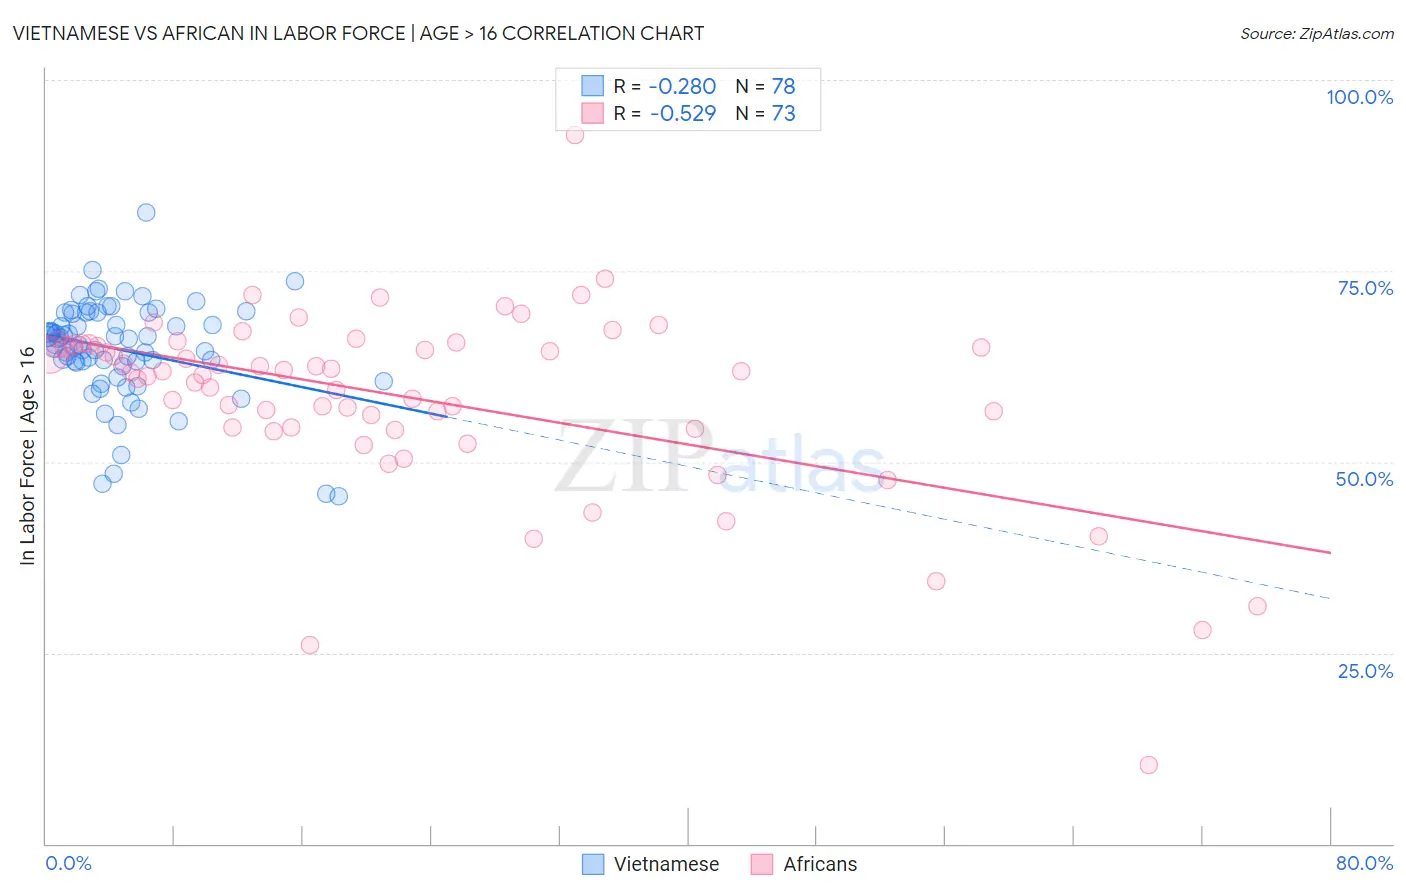
Vietnamese vs African In Labor Force | Age > 16 Correlation Chart
The statistical analysis conducted on geographies consisting of 170,758,607 people shows a weak negative correlation between the proportion of Vietnamese and labor force participation rate among population ages 16 and over in the United States with a correlation coefficient (R) of -0.280 and weighted average of 64.6%. Similarly, the statistical analysis conducted on geographies consisting of 470,091,127 people shows a substantial negative correlation between the proportion of Africans and labor force participation rate among population ages 16 and over in the United States with a correlation coefficient (R) of -0.529 and weighted average of 64.6%, a difference of 0.060%.
In Labor Force | Age > 16 Correlation Summary
| Measurement | Vietnamese | African |
| Minimum | 45.5% | 10.3% |
| Maximum | 82.7% | 92.8% |
| Range | 37.2% | 82.5% |
| Mean | 64.7% | 58.4% |
| Median | 65.8% | 61.6% |
| Interquartile 25% (IQ1) | 63.1% | 54.4% |
| Interquartile 75% (IQ3) | 69.5% | 65.3% |
| Interquartile Range (IQR) | 6.4% | 10.9% |
| Standard Deviation (Sample) | 6.6% | 12.3% |
| Standard Deviation (Population) | 6.5% | 12.2% |
Demographics Similar to Vietnamese and Africans by In Labor Force | Age > 16
In terms of in labor force | age > 16, the demographic groups most similar to Vietnamese are Austrian (64.6%, a difference of 0.0%), Immigrants from Norway (64.6%, a difference of 0.0%), Italian (64.6%, a difference of 0.0%), Slavic (64.6%, a difference of 0.010%), and Lebanese (64.5%, a difference of 0.050%). Similarly, the demographic groups most similar to Africans are Slavic (64.6%, a difference of 0.050%), Austrian (64.6%, a difference of 0.060%), British (64.7%, a difference of 0.070%), Chinese (64.7%, a difference of 0.070%), and Immigrants from Northern Europe (64.7%, a difference of 0.070%).
| Demographics | Rating | Rank | In Labor Force | Age > 16 |
| Immigrants | Belize | 9.2 /100 | #223 | Tragic 64.7% |
| Immigrants | Jamaica | 8.8 /100 | #224 | Tragic 64.7% |
| Croatians | 8.8 /100 | #225 | Tragic 64.7% |
| Europeans | 8.3 /100 | #226 | Tragic 64.7% |
| Poles | 8.3 /100 | #227 | Tragic 64.7% |
| Northern Europeans | 8.2 /100 | #228 | Tragic 64.7% |
| British | 7.3 /100 | #229 | Tragic 64.7% |
| Chinese | 7.3 /100 | #230 | Tragic 64.7% |
| Immigrants | Northern Europe | 7.2 /100 | #231 | Tragic 64.7% |
| Africans | 5.8 /100 | #232 | Tragic 64.6% |
| Slavs | 4.9 /100 | #233 | Tragic 64.6% |
| Vietnamese | 4.7 /100 | #234 | Tragic 64.6% |
| Austrians | 4.6 /100 | #235 | Tragic 64.6% |
| Immigrants | Norway | 4.6 /100 | #236 | Tragic 64.6% |
| Italians | 4.6 /100 | #237 | Tragic 64.6% |
| Lebanese | 3.9 /100 | #238 | Tragic 64.5% |
| Immigrants | Hungary | 3.8 /100 | #239 | Tragic 64.5% |
| Immigrants | Bangladesh | 3.6 /100 | #240 | Tragic 64.5% |
| Immigrants | Dominica | 3.5 /100 | #241 | Tragic 64.5% |
| Immigrants | Netherlands | 3.4 /100 | #242 | Tragic 64.5% |
| Immigrants | Lebanon | 3.2 /100 | #243 | Tragic 64.5% |