Mexican American Indian vs Immigrants from Eastern Asia In Labor Force | Age > 16
COMPARE
Mexican American Indian
Immigrants from Eastern Asia
In Labor Force | Age > 16
In Labor Force | Age > 16 Comparison
Mexican American Indians
Immigrants from Eastern Asia
64.9%
IN LABOR FORCE | AGE > 16
23.1/ 100
METRIC RATING
199th/ 347
METRIC RANK
65.7%
IN LABOR FORCE | AGE > 16
94.9/ 100
METRIC RATING
127th/ 347
METRIC RANK
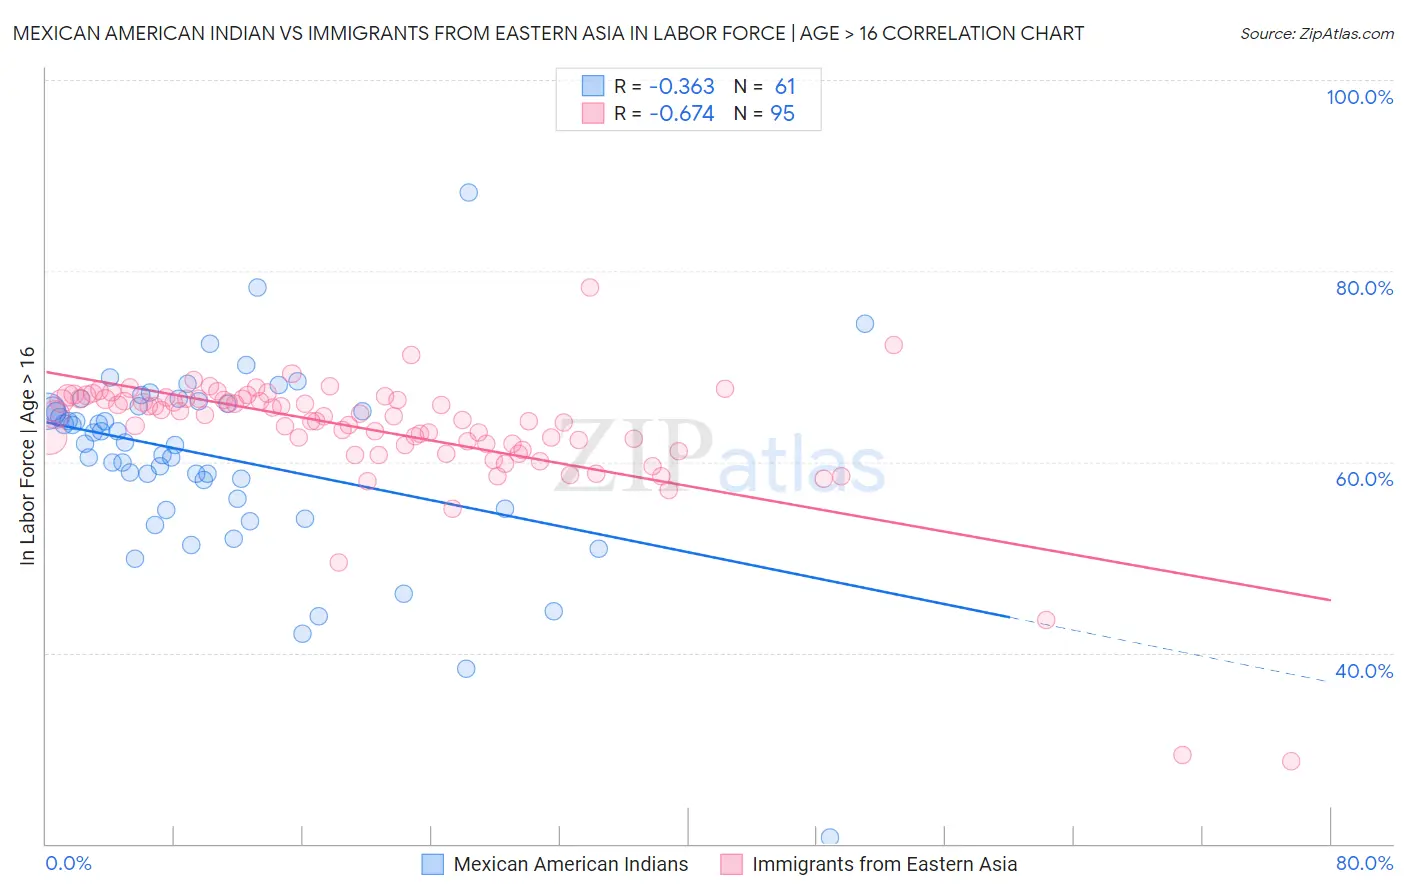
Mexican American Indian vs Immigrants from Eastern Asia In Labor Force | Age > 16 Correlation Chart
The statistical analysis conducted on geographies consisting of 317,603,997 people shows a mild negative correlation between the proportion of Mexican American Indians and labor force participation rate among population ages 16 and over in the United States with a correlation coefficient (R) of -0.363 and weighted average of 64.9%. Similarly, the statistical analysis conducted on geographies consisting of 499,974,052 people shows a significant negative correlation between the proportion of Immigrants from Eastern Asia and labor force participation rate among population ages 16 and over in the United States with a correlation coefficient (R) of -0.674 and weighted average of 65.7%, a difference of 1.2%.
In Labor Force | Age > 16 Correlation Summary
| Measurement | Mexican American Indian | Immigrants from Eastern Asia |
| Minimum | 20.7% | 28.6% |
| Maximum | 88.2% | 78.3% |
| Range | 67.5% | 49.7% |
| Mean | 60.5% | 63.3% |
| Median | 62.1% | 64.8% |
| Interquartile 25% (IQ1) | 55.6% | 61.7% |
| Interquartile 75% (IQ3) | 66.0% | 66.6% |
| Interquartile Range (IQR) | 10.3% | 4.9% |
| Standard Deviation (Sample) | 10.0% | 6.7% |
| Standard Deviation (Population) | 9.9% | 6.7% |
Similar Demographics by In Labor Force | Age > 16
Demographics Similar to Mexican American Indians by In Labor Force | Age > 16
In terms of in labor force | age > 16, the demographic groups most similar to Mexican American Indians are Greek (64.9%, a difference of 0.050%), Armenian (64.9%, a difference of 0.050%), Ukrainian (64.9%, a difference of 0.060%), Immigrants from Belgium (64.9%, a difference of 0.060%), and Russian (64.9%, a difference of 0.070%).
| Demographics | Rating | Rank | In Labor Force | Age > 16 |
| Immigrants | Fiji | 33.7 /100 | #192 | Fair 65.0% |
| Immigrants | Europe | 33.6 /100 | #193 | Fair 65.0% |
| Immigrants | Southern Europe | 31.3 /100 | #194 | Fair 65.0% |
| Romanians | 31.1 /100 | #195 | Fair 65.0% |
| Haitians | 30.6 /100 | #196 | Fair 65.0% |
| Immigrants | Italy | 28.7 /100 | #197 | Fair 65.0% |
| Greeks | 26.1 /100 | #198 | Fair 64.9% |
| Mexican American Indians | 23.1 /100 | #199 | Fair 64.9% |
| Armenians | 20.2 /100 | #200 | Fair 64.9% |
| Ukrainians | 19.6 /100 | #201 | Poor 64.9% |
| Immigrants | Belgium | 19.4 /100 | #202 | Poor 64.9% |
| Russians | 18.8 /100 | #203 | Poor 64.9% |
| Slovenes | 18.7 /100 | #204 | Poor 64.9% |
| Jamaicans | 18.7 /100 | #205 | Poor 64.9% |
| Lithuanians | 17.4 /100 | #206 | Poor 64.8% |
Demographics Similar to Immigrants from Eastern Asia by In Labor Force | Age > 16
In terms of in labor force | age > 16, the demographic groups most similar to Immigrants from Eastern Asia are Ecuadorian (65.6%, a difference of 0.010%), Korean (65.7%, a difference of 0.020%), Immigrants from Philippines (65.6%, a difference of 0.020%), Iraqi (65.7%, a difference of 0.030%), and Norwegian (65.7%, a difference of 0.030%).
| Demographics | Rating | Rank | In Labor Force | Age > 16 |
| Immigrants | Hong Kong | 96.2 /100 | #120 | Exceptional 65.7% |
| New Zealanders | 96.0 /100 | #121 | Exceptional 65.7% |
| Immigrants | Ecuador | 95.9 /100 | #122 | Exceptional 65.7% |
| Immigrants | Iraq | 95.5 /100 | #123 | Exceptional 65.7% |
| Iraqis | 95.4 /100 | #124 | Exceptional 65.7% |
| Norwegians | 95.3 /100 | #125 | Exceptional 65.7% |
| Koreans | 95.3 /100 | #126 | Exceptional 65.7% |
| Immigrants | Eastern Asia | 94.9 /100 | #127 | Exceptional 65.7% |
| Ecuadorians | 94.7 /100 | #128 | Exceptional 65.6% |
| Immigrants | Philippines | 94.5 /100 | #129 | Exceptional 65.6% |
| Immigrants | Guatemala | 94.4 /100 | #130 | Exceptional 65.6% |
| Icelanders | 94.3 /100 | #131 | Exceptional 65.6% |
| Immigrants | North Macedonia | 94.1 /100 | #132 | Exceptional 65.6% |
| Immigrants | Lithuania | 93.5 /100 | #133 | Exceptional 65.6% |
| Costa Ricans | 93.2 /100 | #134 | Exceptional 65.6% |