Immigrants from Grenada vs Immigrants from Eastern Asia In Labor Force | Age > 16
COMPARE
Immigrants from Grenada
Immigrants from Eastern Asia
In Labor Force | Age > 16
In Labor Force | Age > 16 Comparison
Immigrants from Grenada
Immigrants from Eastern Asia
63.6%
IN LABOR FORCE | AGE > 16
0.0/ 100
METRIC RATING
297th/ 347
METRIC RANK
65.7%
IN LABOR FORCE | AGE > 16
94.9/ 100
METRIC RATING
127th/ 347
METRIC RANK
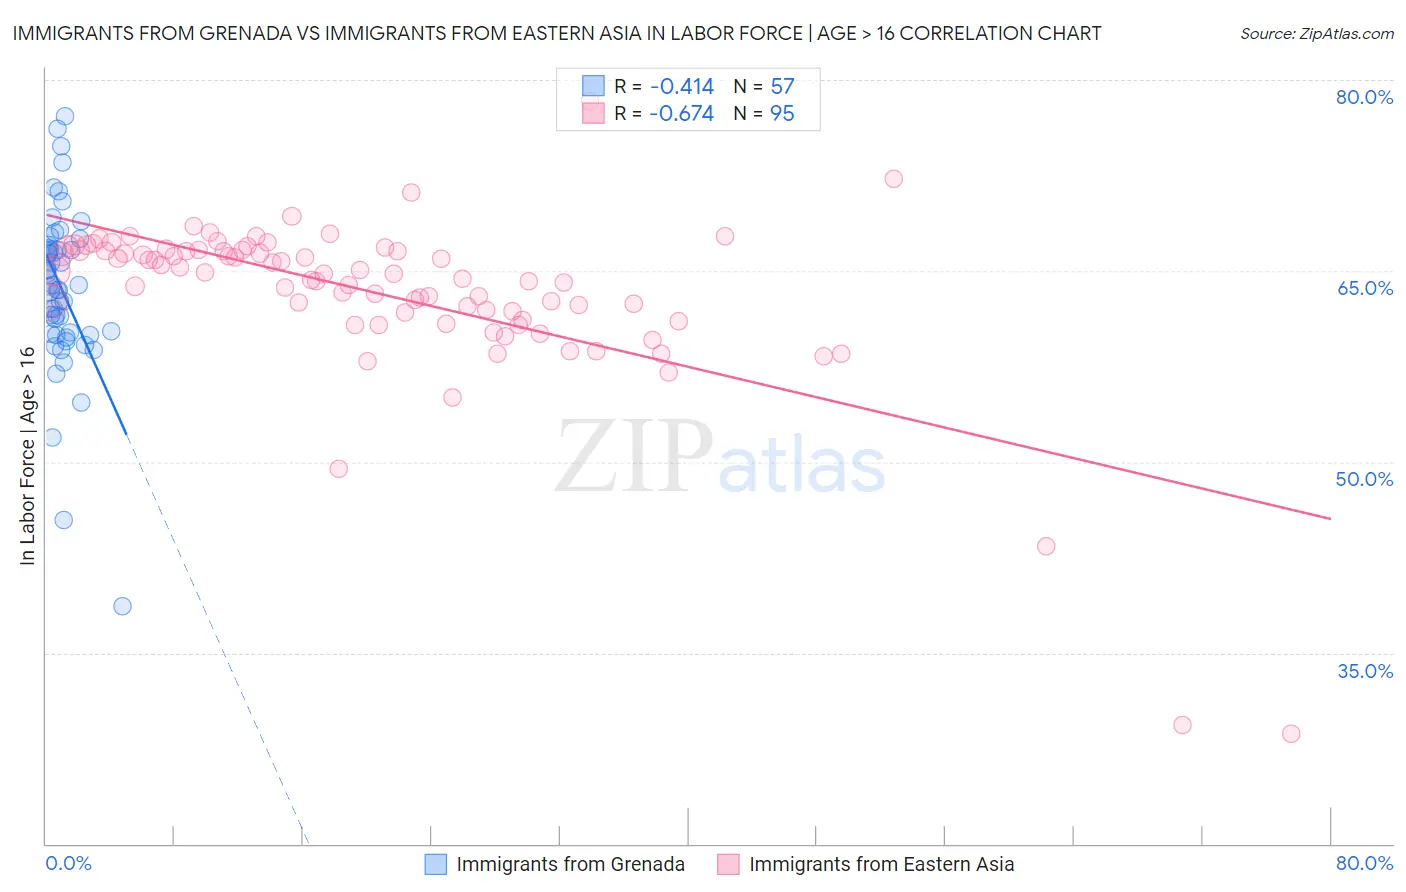
Immigrants from Grenada vs Immigrants from Eastern Asia In Labor Force | Age > 16 Correlation Chart
The statistical analysis conducted on geographies consisting of 67,200,559 people shows a moderate negative correlation between the proportion of Immigrants from Grenada and labor force participation rate among population ages 16 and over in the United States with a correlation coefficient (R) of -0.414 and weighted average of 63.6%. Similarly, the statistical analysis conducted on geographies consisting of 499,974,052 people shows a significant negative correlation between the proportion of Immigrants from Eastern Asia and labor force participation rate among population ages 16 and over in the United States with a correlation coefficient (R) of -0.674 and weighted average of 65.7%, a difference of 3.2%.
In Labor Force | Age > 16 Correlation Summary
| Measurement | Immigrants from Grenada | Immigrants from Eastern Asia |
| Minimum | 38.7% | 28.6% |
| Maximum | 77.2% | 78.3% |
| Range | 38.5% | 49.7% |
| Mean | 63.6% | 63.3% |
| Median | 63.8% | 64.8% |
| Interquartile 25% (IQ1) | 60.1% | 61.7% |
| Interquartile 75% (IQ3) | 66.9% | 66.6% |
| Interquartile Range (IQR) | 6.9% | 4.9% |
| Standard Deviation (Sample) | 6.6% | 6.7% |
| Standard Deviation (Population) | 6.5% | 6.7% |
Similar Demographics by In Labor Force | Age > 16
Demographics Similar to Immigrants from Grenada by In Labor Force | Age > 16
In terms of in labor force | age > 16, the demographic groups most similar to Immigrants from Grenada are Comanche (63.6%, a difference of 0.010%), White/Caucasian (63.6%, a difference of 0.060%), Immigrants from the Azores (63.6%, a difference of 0.070%), Immigrants from North America (63.7%, a difference of 0.080%), and Immigrants from Canada (63.7%, a difference of 0.10%).
| Demographics | Rating | Rank | In Labor Force | Age > 16 |
| Hungarians | 0.1 /100 | #290 | Tragic 63.8% |
| Nepalese | 0.1 /100 | #291 | Tragic 63.8% |
| Spanish American Indians | 0.1 /100 | #292 | Tragic 63.8% |
| English | 0.1 /100 | #293 | Tragic 63.7% |
| Puget Sound Salish | 0.0 /100 | #294 | Tragic 63.7% |
| Immigrants | Canada | 0.0 /100 | #295 | Tragic 63.7% |
| Immigrants | North America | 0.0 /100 | #296 | Tragic 63.7% |
| Immigrants | Grenada | 0.0 /100 | #297 | Tragic 63.6% |
| Comanche | 0.0 /100 | #298 | Tragic 63.6% |
| Whites/Caucasians | 0.0 /100 | #299 | Tragic 63.6% |
| Immigrants | Azores | 0.0 /100 | #300 | Tragic 63.6% |
| Spanish Americans | 0.0 /100 | #301 | Tragic 63.6% |
| Delaware | 0.0 /100 | #302 | Tragic 63.6% |
| Cree | 0.0 /100 | #303 | Tragic 63.5% |
| Immigrants | Nonimmigrants | 0.0 /100 | #304 | Tragic 63.5% |
Demographics Similar to Immigrants from Eastern Asia by In Labor Force | Age > 16
In terms of in labor force | age > 16, the demographic groups most similar to Immigrants from Eastern Asia are Ecuadorian (65.6%, a difference of 0.010%), Korean (65.7%, a difference of 0.020%), Immigrants from Philippines (65.6%, a difference of 0.020%), Iraqi (65.7%, a difference of 0.030%), and Norwegian (65.7%, a difference of 0.030%).
| Demographics | Rating | Rank | In Labor Force | Age > 16 |
| Immigrants | Hong Kong | 96.2 /100 | #120 | Exceptional 65.7% |
| New Zealanders | 96.0 /100 | #121 | Exceptional 65.7% |
| Immigrants | Ecuador | 95.9 /100 | #122 | Exceptional 65.7% |
| Immigrants | Iraq | 95.5 /100 | #123 | Exceptional 65.7% |
| Iraqis | 95.4 /100 | #124 | Exceptional 65.7% |
| Norwegians | 95.3 /100 | #125 | Exceptional 65.7% |
| Koreans | 95.3 /100 | #126 | Exceptional 65.7% |
| Immigrants | Eastern Asia | 94.9 /100 | #127 | Exceptional 65.7% |
| Ecuadorians | 94.7 /100 | #128 | Exceptional 65.6% |
| Immigrants | Philippines | 94.5 /100 | #129 | Exceptional 65.6% |
| Immigrants | Guatemala | 94.4 /100 | #130 | Exceptional 65.6% |
| Icelanders | 94.3 /100 | #131 | Exceptional 65.6% |
| Immigrants | North Macedonia | 94.1 /100 | #132 | Exceptional 65.6% |
| Immigrants | Lithuania | 93.5 /100 | #133 | Exceptional 65.6% |
| Costa Ricans | 93.2 /100 | #134 | Exceptional 65.6% |