Mexican American Indian vs Immigrants from Spain In Labor Force | Age > 16
COMPARE
Mexican American Indian
Immigrants from Spain
In Labor Force | Age > 16
In Labor Force | Age > 16 Comparison
Mexican American Indians
Immigrants from Spain
64.9%
IN LABOR FORCE | AGE > 16
23.1/ 100
METRIC RATING
199th/ 347
METRIC RANK
65.8%
IN LABOR FORCE | AGE > 16
98.0/ 100
METRIC RATING
108th/ 347
METRIC RANK
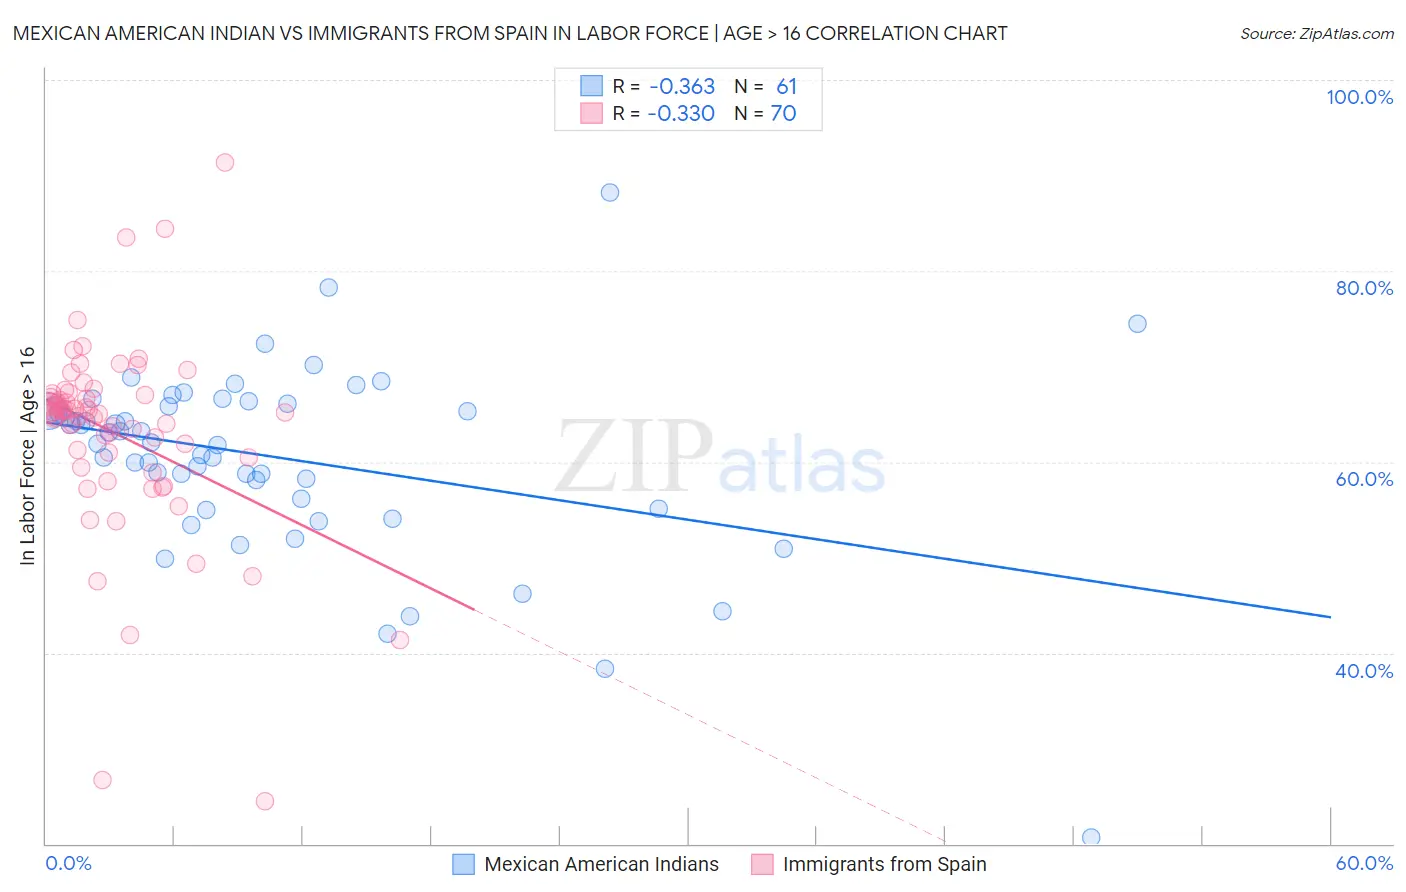
Mexican American Indian vs Immigrants from Spain In Labor Force | Age > 16 Correlation Chart
The statistical analysis conducted on geographies consisting of 317,603,997 people shows a mild negative correlation between the proportion of Mexican American Indians and labor force participation rate among population ages 16 and over in the United States with a correlation coefficient (R) of -0.363 and weighted average of 64.9%. Similarly, the statistical analysis conducted on geographies consisting of 239,685,016 people shows a mild negative correlation between the proportion of Immigrants from Spain and labor force participation rate among population ages 16 and over in the United States with a correlation coefficient (R) of -0.330 and weighted average of 65.8%, a difference of 1.4%.
In Labor Force | Age > 16 Correlation Summary
| Measurement | Mexican American Indian | Immigrants from Spain |
| Minimum | 20.7% | 24.5% |
| Maximum | 88.2% | 91.3% |
| Range | 67.5% | 66.8% |
| Mean | 60.5% | 63.0% |
| Median | 62.1% | 65.2% |
| Interquartile 25% (IQ1) | 55.6% | 60.5% |
| Interquartile 75% (IQ3) | 66.0% | 67.0% |
| Interquartile Range (IQR) | 10.3% | 6.5% |
| Standard Deviation (Sample) | 10.0% | 10.3% |
| Standard Deviation (Population) | 9.9% | 10.3% |
Similar Demographics by In Labor Force | Age > 16
Demographics Similar to Mexican American Indians by In Labor Force | Age > 16
In terms of in labor force | age > 16, the demographic groups most similar to Mexican American Indians are Greek (64.9%, a difference of 0.050%), Armenian (64.9%, a difference of 0.050%), Ukrainian (64.9%, a difference of 0.060%), Immigrants from Belgium (64.9%, a difference of 0.060%), and Russian (64.9%, a difference of 0.070%).
| Demographics | Rating | Rank | In Labor Force | Age > 16 |
| Immigrants | Fiji | 33.7 /100 | #192 | Fair 65.0% |
| Immigrants | Europe | 33.6 /100 | #193 | Fair 65.0% |
| Immigrants | Southern Europe | 31.3 /100 | #194 | Fair 65.0% |
| Romanians | 31.1 /100 | #195 | Fair 65.0% |
| Haitians | 30.6 /100 | #196 | Fair 65.0% |
| Immigrants | Italy | 28.7 /100 | #197 | Fair 65.0% |
| Greeks | 26.1 /100 | #198 | Fair 64.9% |
| Mexican American Indians | 23.1 /100 | #199 | Fair 64.9% |
| Armenians | 20.2 /100 | #200 | Fair 64.9% |
| Ukrainians | 19.6 /100 | #201 | Poor 64.9% |
| Immigrants | Belgium | 19.4 /100 | #202 | Poor 64.9% |
| Russians | 18.8 /100 | #203 | Poor 64.9% |
| Slovenes | 18.7 /100 | #204 | Poor 64.9% |
| Jamaicans | 18.7 /100 | #205 | Poor 64.9% |
| Lithuanians | 17.4 /100 | #206 | Poor 64.8% |
Demographics Similar to Immigrants from Spain by In Labor Force | Age > 16
In terms of in labor force | age > 16, the demographic groups most similar to Immigrants from Spain are Immigrants from Japan (65.8%, a difference of 0.0%), Immigrants from Poland (65.8%, a difference of 0.010%), Immigrants from Serbia (65.8%, a difference of 0.020%), Japanese (65.8%, a difference of 0.040%), and Colombian (65.9%, a difference of 0.060%).
| Demographics | Rating | Rank | In Labor Force | Age > 16 |
| Immigrants | Colombia | 98.6 /100 | #101 | Exceptional 65.9% |
| Uruguayans | 98.6 /100 | #102 | Exceptional 65.9% |
| Immigrants | South Eastern Asia | 98.5 /100 | #103 | Exceptional 65.9% |
| Palestinians | 98.5 /100 | #104 | Exceptional 65.9% |
| Colombians | 98.4 /100 | #105 | Exceptional 65.9% |
| Immigrants | Serbia | 98.1 /100 | #106 | Exceptional 65.8% |
| Immigrants | Poland | 98.1 /100 | #107 | Exceptional 65.8% |
| Immigrants | Spain | 98.0 /100 | #108 | Exceptional 65.8% |
| Immigrants | Japan | 98.0 /100 | #109 | Exceptional 65.8% |
| Japanese | 97.7 /100 | #110 | Exceptional 65.8% |
| Immigrants | Honduras | 97.5 /100 | #111 | Exceptional 65.8% |
| Laotians | 97.4 /100 | #112 | Exceptional 65.8% |
| Pakistanis | 97.1 /100 | #113 | Exceptional 65.8% |
| Hondurans | 97.1 /100 | #114 | Exceptional 65.8% |
| Immigrants | Indonesia | 96.8 /100 | #115 | Exceptional 65.7% |