Immigrants from Bosnia and Herzegovina vs Immigrants from Eastern Asia In Labor Force | Age > 16

COMPARE

Immigrants from Bosnia and Herzegovina
Race
Ancestry
AfghanAfricanAlaska NativeAlaskan AthabascanAlbanianAleutAlsatianAmericanApacheArabArapahoArgentineanArmenianAssyrian/Chaldean/SyriacAustralianAustrianBahamianBangladeshiBarbadianBasqueBelgianBelizeanBermudanBhutaneseBlackfeetBolivianBrazilianBritishBritish West IndianBulgarianBurmeseCajunCambodianCanadianCape VerdeanCarpatho RusynCelticCentral AmericanCentral American IndianCherokeeCheyenneChickasawChileanChineseChippewaChoctawColombianColvilleComancheCosta RicanCreeCreekCroatianCrowCubanCypriotCzechCzechoslovakianDanishDelawareDominicanDutchDutch West IndianEastern EuropeanEcuadorianEgyptianEnglishEstonianEthiopianEuropeanFijianFilipinoFinnishFrenchFrench American IndianFrench CanadianGermanGerman RussianGhanaianGreekGuamanian/ChamorroGuatemalanGuyaneseHaitianHmongHonduranHopiHoumaHungarianIcelanderIndian (Asian)IndonesianInupiatIranianIraqiIrishIroquoisIsraeliItalianJamaicanJapaneseJordanianKenyanKiowaKoreanLaotianLatvianLebaneseLiberianLithuanianLumbeeLuxembourgerMacedonianMalaysianMalteseMarshalleseMenomineeMexicanMexican American IndianMongolianMoroccanNative HawaiianNavajoNepaleseNew ZealanderNicaraguanNigerianNorthern EuropeanNorwegianOkinawanOsageOttawaPaiutePakistaniPalestinianPanamanianParaguayanPennsylvania GermanPeruvianPimaPolishPortuguesePotawatomiPuebloPuerto RicanPuget Sound SalishRomanianRussianSalvadoranSamoanScandinavianScotch-IrishScottishSeminoleSenegaleseSerbianShoshoneSierra LeoneanSiouxSlavicSlovakSloveneSomaliSouth AfricanSouth AmericanSouth American IndianSoviet UnionSpaniardSpanishSpanish AmericanSpanish American IndianSri LankanSubsaharan AfricanSudaneseSwedishSwissSyrianTaiwaneseThaiTlingit-HaidaTohono O'OdhamTonganTrinidadian and TobagonianTsimshianTurkishU.S. Virgin IslanderUgandanUkrainianUruguayanUteVenezuelanVietnameseWelshWest IndianYakamaYaquiYugoslavianYumanYup'ikZimbabwean
Immigration
NonimmigrantsImmigrantsAfghanistanAfricaAlbaniaArgentinaArmeniaAsiaAustraliaAustriaBahamasBangladeshBarbadosBelarusBelgiumBelizeBoliviaBosnia and HerzegovinaBrazilBulgariaBurma/MyanmarCabo VerdeCambodiaCameroonCanadaCaribbeanCentral AmericaChileChinaColombiaCongoCosta RicaCroatiaCubaCzechoslovakiaDenmarkDominicaDominican RepublicEastern AfricaEastern EuropeEcuadorEgyptEl SalvadorEnglandEritreaEthiopiaEuropeFijiFranceGermanyGhanaGreeceGrenadaGuatemalaGuyanaHaitiHondurasHong KongHungaryIndiaIndonesiaIranIraqIrelandIsraelItalyJamaicaJapanJordanKazakhstanKenyaKoreaKuwaitLaosLatin AmericaLatviaLebanonLiberiaLithuaniaMalaysiaMexicoMicronesiaMiddle AfricaMoldovaMoroccoNepalNetherlandsNicaraguaNigeriaNorth AmericaNorth MacedoniaNorthern AfricaNorthern EuropeNorwayOceaniaPakistanPanamaPeruPhilippinesPolandPortugalRomaniaRussiaSaudi ArabiaScotlandSenegalSerbiaSierra LeoneSingaporeSomaliaSouth AfricaSouth AmericaSouth Central AsiaSouth Eastern AsiaSouthern EuropeSpainSri LankaSt. Vincent and the GrenadinesSudanSwedenSwitzerlandSyriaTaiwanThailandTrinidad and TobagoTurkeyUgandaUkraineUruguayUzbekistanVenezuelaVietnamWest IndiesWestern AfricaWestern AsiaWestern EuropeYemenZaireZimbabweAzores
Immigrants from Eastern Asia
Race
Ancestry
AfghanAfricanAlaska NativeAlaskan AthabascanAlbanianAleutAlsatianAmericanApacheArabArapahoArgentineanArmenianAssyrian/Chaldean/SyriacAustralianAustrianBahamianBangladeshiBarbadianBasqueBelgianBelizeanBermudanBhutaneseBlackfeetBolivianBrazilianBritishBritish West IndianBulgarianBurmeseCajunCambodianCanadianCape VerdeanCarpatho RusynCelticCentral AmericanCentral American IndianCherokeeCheyenneChickasawChileanChineseChippewaChoctawColombianColvilleComancheCosta RicanCreeCreekCroatianCrowCubanCypriotCzechCzechoslovakianDanishDelawareDominicanDutchDutch West IndianEastern EuropeanEcuadorianEgyptianEnglishEstonianEthiopianEuropeanFijianFilipinoFinnishFrenchFrench American IndianFrench CanadianGermanGerman RussianGhanaianGreekGuamanian/ChamorroGuatemalanGuyaneseHaitianHmongHonduranHopiHoumaHungarianIcelanderIndian (Asian)IndonesianInupiatIranianIraqiIrishIroquoisIsraeliItalianJamaicanJapaneseJordanianKenyanKiowaKoreanLaotianLatvianLebaneseLiberianLithuanianLumbeeLuxembourgerMacedonianMalaysianMalteseMarshalleseMenomineeMexicanMexican American IndianMongolianMoroccanNative HawaiianNavajoNepaleseNew ZealanderNicaraguanNigerianNorthern EuropeanNorwegianOkinawanOsageOttawaPaiutePakistaniPalestinianPanamanianParaguayanPennsylvania GermanPeruvianPimaPolishPortuguesePotawatomiPuebloPuerto RicanPuget Sound SalishRomanianRussianSalvadoranSamoanScandinavianScotch-IrishScottishSeminoleSenegaleseSerbianShoshoneSierra LeoneanSiouxSlavicSlovakSloveneSomaliSouth AfricanSouth AmericanSouth American IndianSoviet UnionSpaniardSpanishSpanish AmericanSpanish American IndianSri LankanSubsaharan AfricanSudaneseSwedishSwissSyrianTaiwaneseThaiTlingit-HaidaTohono O'OdhamTonganTrinidadian and TobagonianTsimshianTurkishU.S. Virgin IslanderUgandanUkrainianUruguayanUteVenezuelanVietnameseWelshWest IndianYakamaYaquiYugoslavianYumanYup'ikZimbabwean
Immigration
NonimmigrantsImmigrantsAfghanistanAfricaAlbaniaArgentinaArmeniaAsiaAustraliaAustriaBahamasBangladeshBarbadosBelarusBelgiumBelizeBoliviaBrazilBulgariaBurma/MyanmarCabo VerdeCambodiaCameroonCanadaCaribbeanCentral AmericaChileChinaColombiaCongoCosta RicaCroatiaCubaCzechoslovakiaDenmarkDominicaDominican RepublicEastern AfricaEastern AsiaEastern EuropeEcuadorEgyptEl SalvadorEnglandEritreaEthiopiaEuropeFijiFranceGermanyGhanaGreeceGrenadaGuatemalaGuyanaHaitiHondurasHong KongHungaryIndiaIndonesiaIranIraqIrelandIsraelItalyJamaicaJapanJordanKazakhstanKenyaKoreaKuwaitLaosLatin AmericaLatviaLebanonLiberiaLithuaniaMalaysiaMexicoMicronesiaMiddle AfricaMoldovaMoroccoNepalNetherlandsNicaraguaNigeriaNorth AmericaNorth MacedoniaNorthern AfricaNorthern EuropeNorwayOceaniaPakistanPanamaPeruPhilippinesPolandPortugalRomaniaRussiaSaudi ArabiaScotlandSenegalSerbiaSierra LeoneSingaporeSomaliaSouth AfricaSouth AmericaSouth Central AsiaSouth Eastern AsiaSouthern EuropeSpainSri LankaSt. Vincent and the GrenadinesSudanSwedenSwitzerlandSyriaTaiwanThailandTrinidad and TobagoTurkeyUgandaUkraineUruguayUzbekistanVenezuelaVietnamWest IndiesWestern AfricaWestern AsiaWestern EuropeYemenZaireZimbabweAzores
In Labor Force | Age > 16
Income
Poverty
Unemployment
Labor Participation
Family Structure
Vehicle Availability
Education Level
Disability

In Labor Force | Age > 16 Comparison

Immigrants from Bosnia and Herzegovina

Immigrants from Eastern Asia

Exceptional
Exceptional
66.5%
IN LABOR FORCE | AGE > 16
99.9/ 100
METRIC RATING
54th/ 347
METRIC RANK
65.7%
IN LABOR FORCE | AGE > 16
94.9/ 100
METRIC RATING
127th/ 347
METRIC RANK

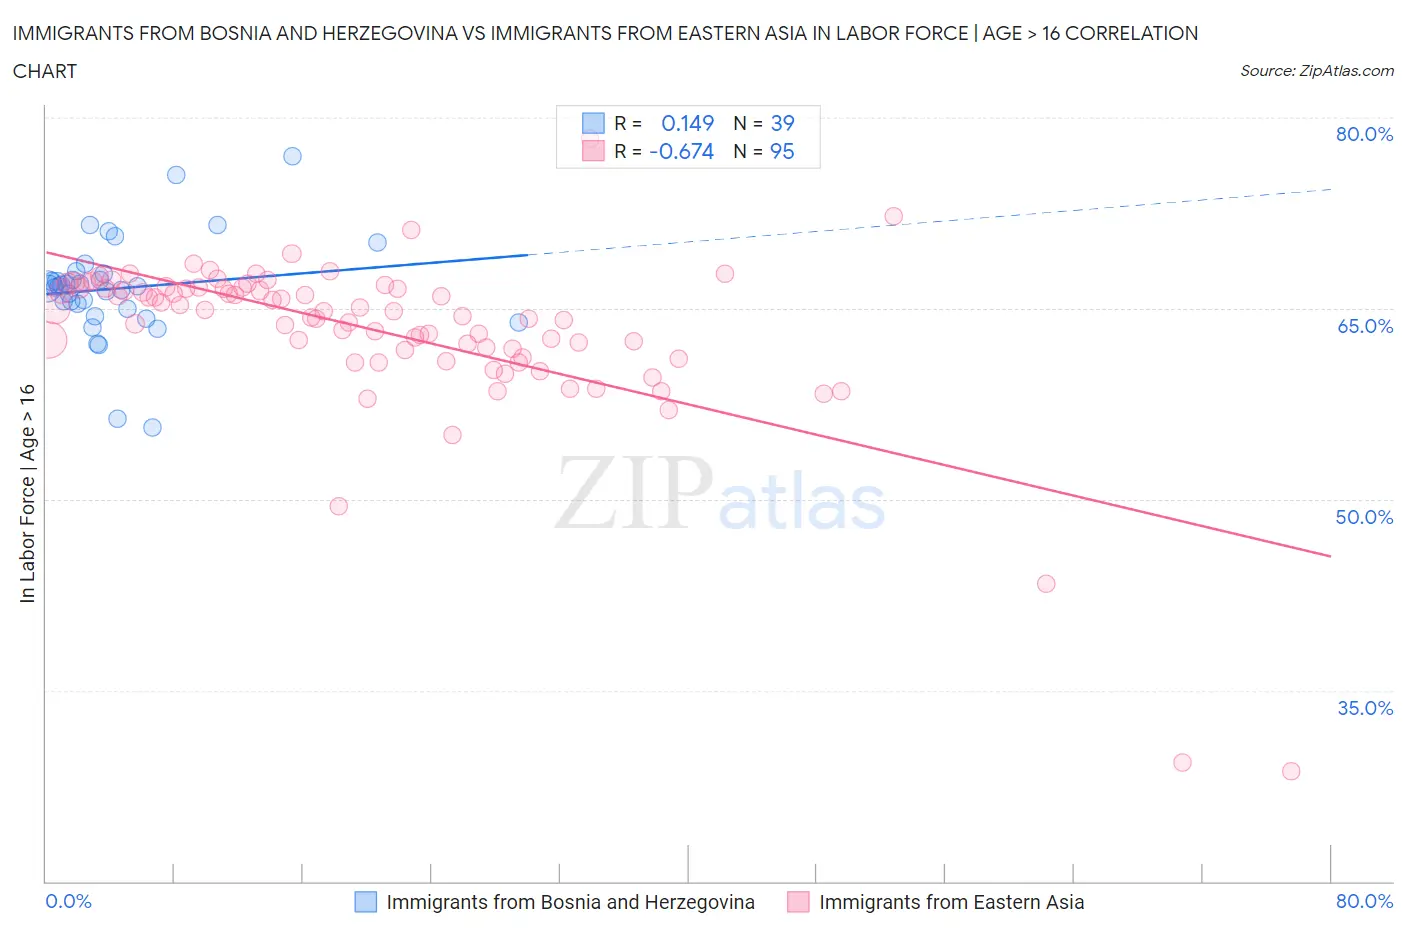
Immigrants from Bosnia and Herzegovina vs Immigrants from Eastern Asia In Labor Force | Age > 16 Correlation Chart

The statistical analysis conducted on geographies consisting of 156,819,568 people shows a poor positive correlation between the proportion of Immigrants from Bosnia and Herzegovina and labor force participation rate among population ages 16 and over in the United States with a correlation coefficient (R) of 0.149 and weighted average of 66.5%. Similarly, the statistical analysis conducted on geographies consisting of 499,974,052 people shows a significant negative correlation between the proportion of Immigrants from Eastern Asia and labor force participation rate among population ages 16 and over in the United States with a correlation coefficient (R) of -0.674 and weighted average of 65.7%, a difference of 1.2%.
Immigrants from Bosnia and Herzegovina vs Immigrants from Eastern Asia In Labor Force | Age > 16

In Labor Force | Age > 16 Correlation Summary

MeasurementImmigrants from Bosnia and HerzegovinaImmigrants from Eastern Asia
Minimum55.6%28.6%
Maximum77.0%78.3%
Range21.4%49.7%
Mean66.6%63.3%
Median66.8%64.8%
Interquartile 25% (IQ1)65.0%61.7%
Interquartile 75% (IQ3)67.7%66.6%
Interquartile Range (IQR)2.8%4.9%
Standard Deviation (Sample)4.0%6.7%
Standard Deviation (Population)3.9%6.7%

Similar Demographics by In Labor Force | Age > 16

Demographics Similar to Immigrants from Bosnia and Herzegovina by In Labor Force | Age > 16

In terms of in labor force | age > 16, the demographic groups most similar to Immigrants from Bosnia and Herzegovina are Immigrants from Sri Lanka (66.5%, a difference of 0.030%), Paraguayan (66.5%, a difference of 0.050%), Immigrants from Venezuela (66.4%, a difference of 0.050%), Immigrants from Kuwait (66.5%, a difference of 0.080%), and Immigrants from Senegal (66.4%, a difference of 0.080%).
DemographicsRating | RankIn Labor Force | Age > 16
Immigrants | Bulgaria
100.0
/100
|
#47
Exceptional
66.6%
Nigerians
100.0
/100
|
#48
Exceptional
66.6%
Immigrants | Northern Africa
100.0
/100
|
#49
Exceptional
66.6%
Cape Verdeans
100.0
/100
|
#50
Exceptional
66.6%
Immigrants | Kuwait
100.0
/100
|
#51
Exceptional
66.5%
Paraguayans
99.9
/100
|
#52
Exceptional
66.5%
Immigrants | Sri Lanka
99.9
/100
|
#53
Exceptional
66.5%
Immigrants | Bosnia and Herzegovina
99.9
/100
|
#54
Exceptional
66.5%
Immigrants | Venezuela
99.9
/100
|
#55
Exceptional
66.4%
Immigrants | Senegal
99.9
/100
|
#56
Exceptional
66.4%
Bulgarians
99.9
/100
|
#57
Exceptional
66.4%
Immigrants | Saudi Arabia
99.9
/100
|
#58
Exceptional
66.3%
Immigrants | Turkey
99.9
/100
|
#59
Exceptional
66.3%
Immigrants | Peru
99.8
/100
|
#60
Exceptional
66.3%
Immigrants | Burma/Myanmar
99.8
/100
|
#61
Exceptional
66.3%

Demographics Similar to Immigrants from Eastern Asia by In Labor Force | Age > 16

In terms of in labor force | age > 16, the demographic groups most similar to Immigrants from Eastern Asia are Ecuadorian (65.6%, a difference of 0.010%), Korean (65.7%, a difference of 0.020%), Immigrants from Philippines (65.6%, a difference of 0.020%), Iraqi (65.7%, a difference of 0.030%), and Norwegian (65.7%, a difference of 0.030%).
DemographicsRating | RankIn Labor Force | Age > 16
Immigrants | Hong Kong
96.2
/100
|
#120
Exceptional
65.7%
New Zealanders
96.0
/100
|
#121
Exceptional
65.7%
Immigrants | Ecuador
95.9
/100
|
#122
Exceptional
65.7%
Immigrants | Iraq
95.5
/100
|
#123
Exceptional
65.7%
Iraqis
95.4
/100
|
#124
Exceptional
65.7%
Norwegians
95.3
/100
|
#125
Exceptional
65.7%
Koreans
95.3
/100
|
#126
Exceptional
65.7%
Immigrants | Eastern Asia
94.9
/100
|
#127
Exceptional
65.7%
Ecuadorians
94.7
/100
|
#128
Exceptional
65.6%
Immigrants | Philippines
94.5
/100
|
#129
Exceptional
65.6%
Immigrants | Guatemala
94.4
/100
|
#130
Exceptional
65.6%
Icelanders
94.3
/100
|
#131
Exceptional
65.6%
Immigrants | North Macedonia
94.1
/100
|
#132
Exceptional
65.6%
Immigrants | Lithuania
93.5
/100
|
#133
Exceptional
65.6%
Costa Ricans
93.2
/100
|
#134
Exceptional
65.6%