Immigrants from Uganda vs Immigrants from Eastern Asia In Labor Force | Age > 16
COMPARE
Immigrants from Uganda
Immigrants from Eastern Asia
In Labor Force | Age > 16
In Labor Force | Age > 16 Comparison
Immigrants from Uganda
Immigrants from Eastern Asia
67.5%
IN LABOR FORCE | AGE > 16
100.0/ 100
METRIC RATING
22nd/ 347
METRIC RANK
65.7%
IN LABOR FORCE | AGE > 16
94.9/ 100
METRIC RATING
127th/ 347
METRIC RANK
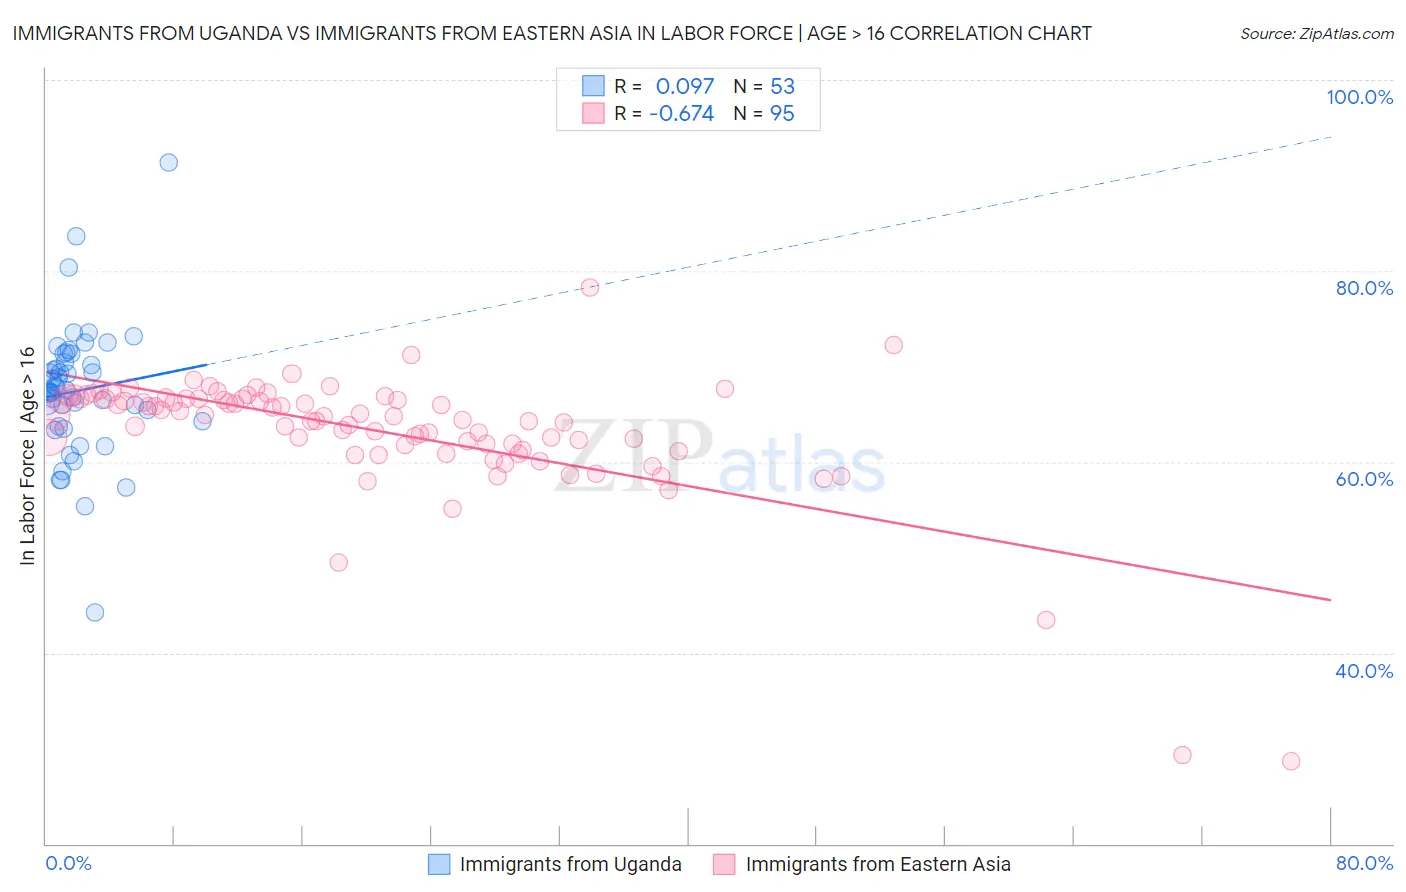
Immigrants from Uganda vs Immigrants from Eastern Asia In Labor Force | Age > 16 Correlation Chart
The statistical analysis conducted on geographies consisting of 125,982,197 people shows a slight positive correlation between the proportion of Immigrants from Uganda and labor force participation rate among population ages 16 and over in the United States with a correlation coefficient (R) of 0.097 and weighted average of 67.5%. Similarly, the statistical analysis conducted on geographies consisting of 499,974,052 people shows a significant negative correlation between the proportion of Immigrants from Eastern Asia and labor force participation rate among population ages 16 and over in the United States with a correlation coefficient (R) of -0.674 and weighted average of 65.7%, a difference of 2.8%.
In Labor Force | Age > 16 Correlation Summary
| Measurement | Immigrants from Uganda | Immigrants from Eastern Asia |
| Minimum | 44.2% | 28.6% |
| Maximum | 91.4% | 78.3% |
| Range | 47.2% | 49.7% |
| Mean | 67.4% | 63.3% |
| Median | 67.4% | 64.8% |
| Interquartile 25% (IQ1) | 64.0% | 61.7% |
| Interquartile 75% (IQ3) | 70.8% | 66.6% |
| Interquartile Range (IQR) | 6.8% | 4.9% |
| Standard Deviation (Sample) | 7.0% | 6.7% |
| Standard Deviation (Population) | 6.9% | 6.7% |
Similar Demographics by In Labor Force | Age > 16
Demographics Similar to Immigrants from Uganda by In Labor Force | Age > 16
In terms of in labor force | age > 16, the demographic groups most similar to Immigrants from Uganda are Tongan (67.5%, a difference of 0.060%), Immigrants from Kenya (67.6%, a difference of 0.080%), Cambodian (67.4%, a difference of 0.12%), Kenyan (67.6%, a difference of 0.13%), and Immigrants from Liberia (67.6%, a difference of 0.16%).
| Demographics | Rating | Rank | In Labor Force | Age > 16 |
| Immigrants | Middle Africa | 100.0 /100 | #15 | Exceptional 67.7% |
| Immigrants | Sudan | 100.0 /100 | #16 | Exceptional 67.7% |
| Immigrants | India | 100.0 /100 | #17 | Exceptional 67.6% |
| Immigrants | Liberia | 100.0 /100 | #18 | Exceptional 67.6% |
| Kenyans | 100.0 /100 | #19 | Exceptional 67.6% |
| Immigrants | Kenya | 100.0 /100 | #20 | Exceptional 67.6% |
| Tongans | 100.0 /100 | #21 | Exceptional 67.5% |
| Immigrants | Uganda | 100.0 /100 | #22 | Exceptional 67.5% |
| Cambodians | 100.0 /100 | #23 | Exceptional 67.4% |
| Ugandans | 100.0 /100 | #24 | Exceptional 67.4% |
| Immigrants | Africa | 100.0 /100 | #25 | Exceptional 67.4% |
| Immigrants | Cabo Verde | 100.0 /100 | #26 | Exceptional 67.3% |
| Zimbabweans | 100.0 /100 | #27 | Exceptional 67.3% |
| Immigrants | Morocco | 100.0 /100 | #28 | Exceptional 67.2% |
| Thais | 100.0 /100 | #29 | Exceptional 67.2% |
Demographics Similar to Immigrants from Eastern Asia by In Labor Force | Age > 16
In terms of in labor force | age > 16, the demographic groups most similar to Immigrants from Eastern Asia are Ecuadorian (65.6%, a difference of 0.010%), Korean (65.7%, a difference of 0.020%), Immigrants from Philippines (65.6%, a difference of 0.020%), Iraqi (65.7%, a difference of 0.030%), and Norwegian (65.7%, a difference of 0.030%).
| Demographics | Rating | Rank | In Labor Force | Age > 16 |
| Immigrants | Hong Kong | 96.2 /100 | #120 | Exceptional 65.7% |
| New Zealanders | 96.0 /100 | #121 | Exceptional 65.7% |
| Immigrants | Ecuador | 95.9 /100 | #122 | Exceptional 65.7% |
| Immigrants | Iraq | 95.5 /100 | #123 | Exceptional 65.7% |
| Iraqis | 95.4 /100 | #124 | Exceptional 65.7% |
| Norwegians | 95.3 /100 | #125 | Exceptional 65.7% |
| Koreans | 95.3 /100 | #126 | Exceptional 65.7% |
| Immigrants | Eastern Asia | 94.9 /100 | #127 | Exceptional 65.7% |
| Ecuadorians | 94.7 /100 | #128 | Exceptional 65.6% |
| Immigrants | Philippines | 94.5 /100 | #129 | Exceptional 65.6% |
| Immigrants | Guatemala | 94.4 /100 | #130 | Exceptional 65.6% |
| Icelanders | 94.3 /100 | #131 | Exceptional 65.6% |
| Immigrants | North Macedonia | 94.1 /100 | #132 | Exceptional 65.6% |
| Immigrants | Lithuania | 93.5 /100 | #133 | Exceptional 65.6% |
| Costa Ricans | 93.2 /100 | #134 | Exceptional 65.6% |