Mexican American Indian vs Hispanic or Latino In Labor Force | Age > 16
COMPARE
Mexican American Indian
Hispanic or Latino
In Labor Force | Age > 16
In Labor Force | Age > 16 Comparison
Mexican American Indians
Hispanics or Latinos
64.9%
IN LABOR FORCE | AGE > 16
23.1/ 100
METRIC RATING
199th/ 347
METRIC RANK
64.3%
IN LABOR FORCE | AGE > 16
1.1/ 100
METRIC RATING
255th/ 347
METRIC RANK
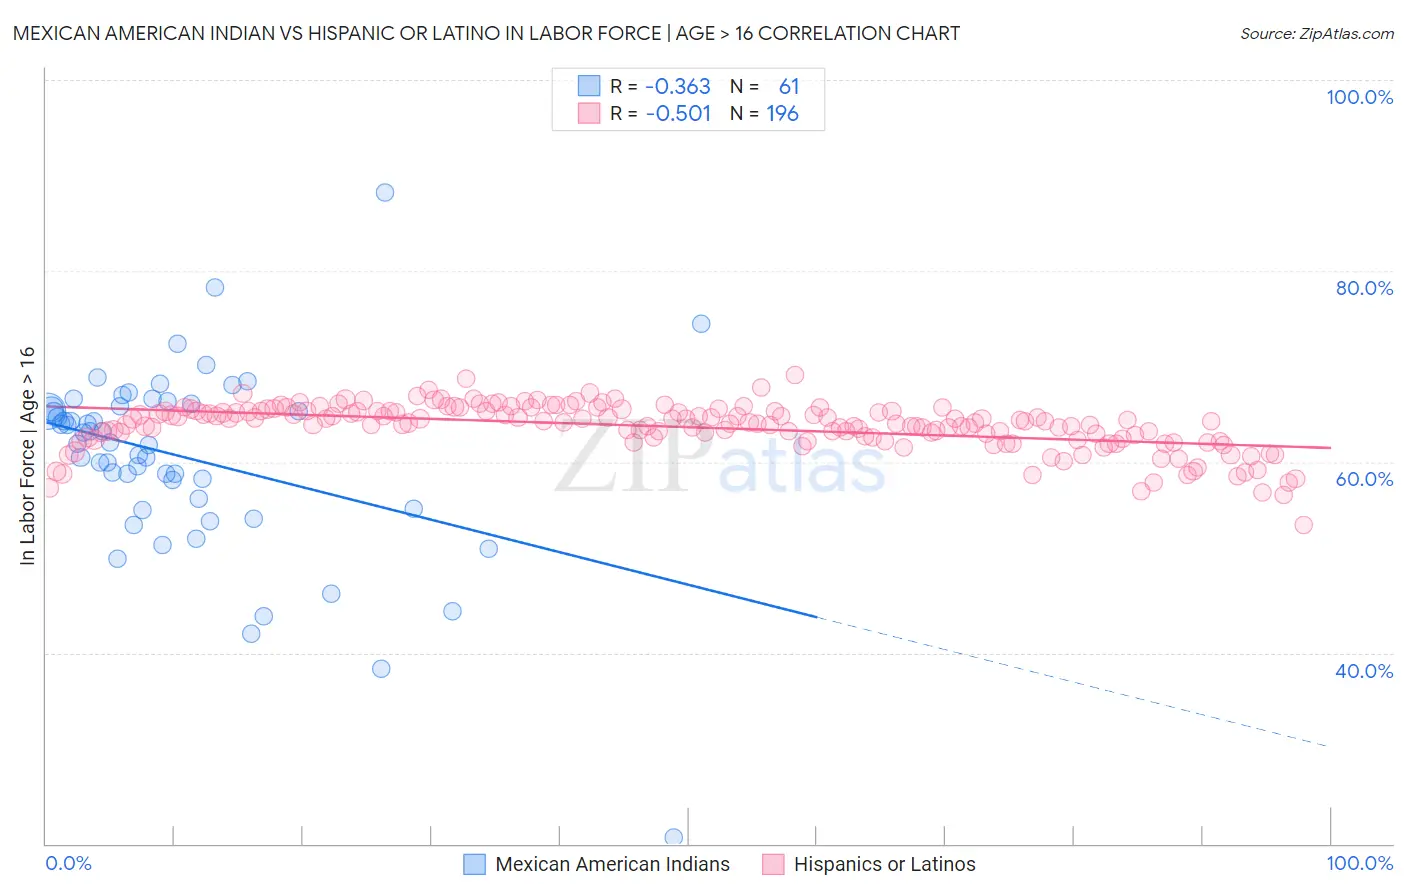
Mexican American Indian vs Hispanic or Latino In Labor Force | Age > 16 Correlation Chart
The statistical analysis conducted on geographies consisting of 317,603,997 people shows a mild negative correlation between the proportion of Mexican American Indians and labor force participation rate among population ages 16 and over in the United States with a correlation coefficient (R) of -0.363 and weighted average of 64.9%. Similarly, the statistical analysis conducted on geographies consisting of 574,025,710 people shows a substantial negative correlation between the proportion of Hispanics or Latinos and labor force participation rate among population ages 16 and over in the United States with a correlation coefficient (R) of -0.501 and weighted average of 64.3%, a difference of 0.93%.
In Labor Force | Age > 16 Correlation Summary
| Measurement | Mexican American Indian | Hispanic or Latino |
| Minimum | 20.7% | 53.4% |
| Maximum | 88.2% | 69.1% |
| Range | 67.5% | 15.7% |
| Mean | 60.5% | 63.7% |
| Median | 62.1% | 64.1% |
| Interquartile 25% (IQ1) | 55.6% | 62.5% |
| Interquartile 75% (IQ3) | 66.0% | 65.3% |
| Interquartile Range (IQR) | 10.3% | 2.8% |
| Standard Deviation (Sample) | 10.0% | 2.5% |
| Standard Deviation (Population) | 9.9% | 2.5% |
Similar Demographics by In Labor Force | Age > 16
Demographics Similar to Mexican American Indians by In Labor Force | Age > 16
In terms of in labor force | age > 16, the demographic groups most similar to Mexican American Indians are Greek (64.9%, a difference of 0.050%), Armenian (64.9%, a difference of 0.050%), Ukrainian (64.9%, a difference of 0.060%), Immigrants from Belgium (64.9%, a difference of 0.060%), and Russian (64.9%, a difference of 0.070%).
| Demographics | Rating | Rank | In Labor Force | Age > 16 |
| Immigrants | Fiji | 33.7 /100 | #192 | Fair 65.0% |
| Immigrants | Europe | 33.6 /100 | #193 | Fair 65.0% |
| Immigrants | Southern Europe | 31.3 /100 | #194 | Fair 65.0% |
| Romanians | 31.1 /100 | #195 | Fair 65.0% |
| Haitians | 30.6 /100 | #196 | Fair 65.0% |
| Immigrants | Italy | 28.7 /100 | #197 | Fair 65.0% |
| Greeks | 26.1 /100 | #198 | Fair 64.9% |
| Mexican American Indians | 23.1 /100 | #199 | Fair 64.9% |
| Armenians | 20.2 /100 | #200 | Fair 64.9% |
| Ukrainians | 19.6 /100 | #201 | Poor 64.9% |
| Immigrants | Belgium | 19.4 /100 | #202 | Poor 64.9% |
| Russians | 18.8 /100 | #203 | Poor 64.9% |
| Slovenes | 18.7 /100 | #204 | Poor 64.9% |
| Jamaicans | 18.7 /100 | #205 | Poor 64.9% |
| Lithuanians | 17.4 /100 | #206 | Poor 64.8% |
Demographics Similar to Hispanics or Latinos by In Labor Force | Age > 16
In terms of in labor force | age > 16, the demographic groups most similar to Hispanics or Latinos are Immigrants from Mexico (64.3%, a difference of 0.040%), Immigrants from Uzbekistan (64.3%, a difference of 0.070%), Immigrants from Dominican Republic (64.4%, a difference of 0.080%), Czechoslovakian (64.3%, a difference of 0.080%), and Inupiat (64.3%, a difference of 0.080%).
| Demographics | Rating | Rank | In Labor Force | Age > 16 |
| Immigrants | Barbados | 2.1 /100 | #248 | Tragic 64.4% |
| Germans | 1.8 /100 | #249 | Tragic 64.4% |
| British West Indians | 1.8 /100 | #250 | Tragic 64.4% |
| Portuguese | 1.6 /100 | #251 | Tragic 64.4% |
| Immigrants | Dominican Republic | 1.5 /100 | #252 | Tragic 64.4% |
| Czechoslovakians | 1.4 /100 | #253 | Tragic 64.3% |
| Immigrants | Uzbekistan | 1.4 /100 | #254 | Tragic 64.3% |
| Hispanics or Latinos | 1.1 /100 | #255 | Tragic 64.3% |
| Immigrants | Mexico | 1.0 /100 | #256 | Tragic 64.3% |
| Inupiat | 0.8 /100 | #257 | Tragic 64.3% |
| Immigrants | Scotland | 0.8 /100 | #258 | Tragic 64.2% |
| Immigrants | Western Europe | 0.7 /100 | #259 | Tragic 64.2% |
| Marshallese | 0.7 /100 | #260 | Tragic 64.2% |
| Basques | 0.7 /100 | #261 | Tragic 64.2% |
| Finns | 0.7 /100 | #262 | Tragic 64.2% |