Mexican American Indian vs Menominee In Labor Force | Age > 16
COMPARE
Mexican American Indian
Menominee
In Labor Force | Age > 16
In Labor Force | Age > 16 Comparison
Mexican American Indians
Menominee
64.9%
IN LABOR FORCE | AGE > 16
23.1/ 100
METRIC RATING
199th/ 347
METRIC RANK
60.6%
IN LABOR FORCE | AGE > 16
0.0/ 100
METRIC RATING
336th/ 347
METRIC RANK
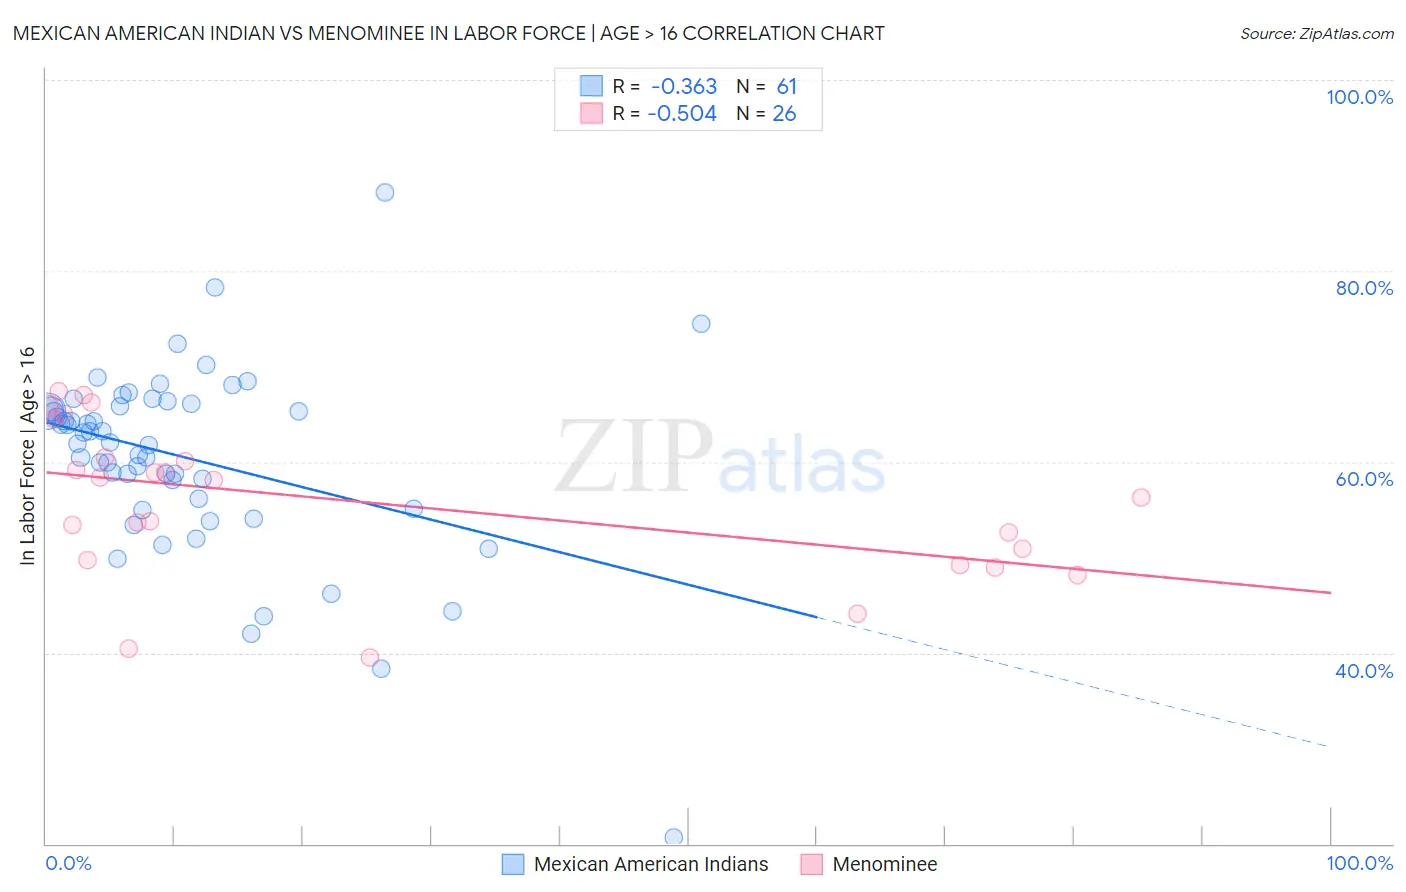
Mexican American Indian vs Menominee In Labor Force | Age > 16 Correlation Chart
The statistical analysis conducted on geographies consisting of 317,603,997 people shows a mild negative correlation between the proportion of Mexican American Indians and labor force participation rate among population ages 16 and over in the United States with a correlation coefficient (R) of -0.363 and weighted average of 64.9%. Similarly, the statistical analysis conducted on geographies consisting of 45,777,849 people shows a substantial negative correlation between the proportion of Menominee and labor force participation rate among population ages 16 and over in the United States with a correlation coefficient (R) of -0.504 and weighted average of 60.6%, a difference of 7.1%.
In Labor Force | Age > 16 Correlation Summary
| Measurement | Mexican American Indian | Menominee |
| Minimum | 20.7% | 39.5% |
| Maximum | 88.2% | 67.4% |
| Range | 67.5% | 27.9% |
| Mean | 60.5% | 55.8% |
| Median | 62.1% | 57.2% |
| Interquartile 25% (IQ1) | 55.6% | 49.8% |
| Interquartile 75% (IQ3) | 66.0% | 60.5% |
| Interquartile Range (IQR) | 10.3% | 10.7% |
| Standard Deviation (Sample) | 10.0% | 8.0% |
| Standard Deviation (Population) | 9.9% | 7.8% |
Similar Demographics by In Labor Force | Age > 16
Demographics Similar to Mexican American Indians by In Labor Force | Age > 16
In terms of in labor force | age > 16, the demographic groups most similar to Mexican American Indians are Greek (64.9%, a difference of 0.050%), Armenian (64.9%, a difference of 0.050%), Ukrainian (64.9%, a difference of 0.060%), Immigrants from Belgium (64.9%, a difference of 0.060%), and Russian (64.9%, a difference of 0.070%).
| Demographics | Rating | Rank | In Labor Force | Age > 16 |
| Immigrants | Fiji | 33.7 /100 | #192 | Fair 65.0% |
| Immigrants | Europe | 33.6 /100 | #193 | Fair 65.0% |
| Immigrants | Southern Europe | 31.3 /100 | #194 | Fair 65.0% |
| Romanians | 31.1 /100 | #195 | Fair 65.0% |
| Haitians | 30.6 /100 | #196 | Fair 65.0% |
| Immigrants | Italy | 28.7 /100 | #197 | Fair 65.0% |
| Greeks | 26.1 /100 | #198 | Fair 64.9% |
| Mexican American Indians | 23.1 /100 | #199 | Fair 64.9% |
| Armenians | 20.2 /100 | #200 | Fair 64.9% |
| Ukrainians | 19.6 /100 | #201 | Poor 64.9% |
| Immigrants | Belgium | 19.4 /100 | #202 | Poor 64.9% |
| Russians | 18.8 /100 | #203 | Poor 64.9% |
| Slovenes | 18.7 /100 | #204 | Poor 64.9% |
| Jamaicans | 18.7 /100 | #205 | Poor 64.9% |
| Lithuanians | 17.4 /100 | #206 | Poor 64.8% |
Demographics Similar to Menominee by In Labor Force | Age > 16
In terms of in labor force | age > 16, the demographic groups most similar to Menominee are Native/Alaskan (60.6%, a difference of 0.020%), Apache (60.7%, a difference of 0.21%), Paiute (60.7%, a difference of 0.26%), Crow (60.8%, a difference of 0.34%), and Ute (60.9%, a difference of 0.51%).
| Demographics | Rating | Rank | In Labor Force | Age > 16 |
| Choctaw | 0.0 /100 | #329 | Tragic 61.5% |
| Creek | 0.0 /100 | #330 | Tragic 61.3% |
| Ute | 0.0 /100 | #331 | Tragic 60.9% |
| Crow | 0.0 /100 | #332 | Tragic 60.8% |
| Paiute | 0.0 /100 | #333 | Tragic 60.7% |
| Apache | 0.0 /100 | #334 | Tragic 60.7% |
| Natives/Alaskans | 0.0 /100 | #335 | Tragic 60.6% |
| Menominee | 0.0 /100 | #336 | Tragic 60.6% |
| Colville | 0.0 /100 | #337 | Tragic 59.8% |
| Immigrants | Yemen | 0.0 /100 | #338 | Tragic 59.6% |
| Houma | 0.0 /100 | #339 | Tragic 59.5% |
| Pueblo | 0.0 /100 | #340 | Tragic 59.3% |
| Hopi | 0.0 /100 | #341 | Tragic 58.4% |
| Puerto Ricans | 0.0 /100 | #342 | Tragic 58.1% |
| Yuman | 0.0 /100 | #343 | Tragic 57.8% |