Mexican American Indian vs Assyrian/Chaldean/Syriac In Labor Force | Age > 16
COMPARE
Mexican American Indian
Assyrian/Chaldean/Syriac
In Labor Force | Age > 16
In Labor Force | Age > 16 Comparison
Mexican American Indians
Assyrians/Chaldeans/Syriacs
64.9%
IN LABOR FORCE | AGE > 16
23.1/ 100
METRIC RATING
199th/ 347
METRIC RANK
64.0%
IN LABOR FORCE | AGE > 16
0.3/ 100
METRIC RATING
278th/ 347
METRIC RANK
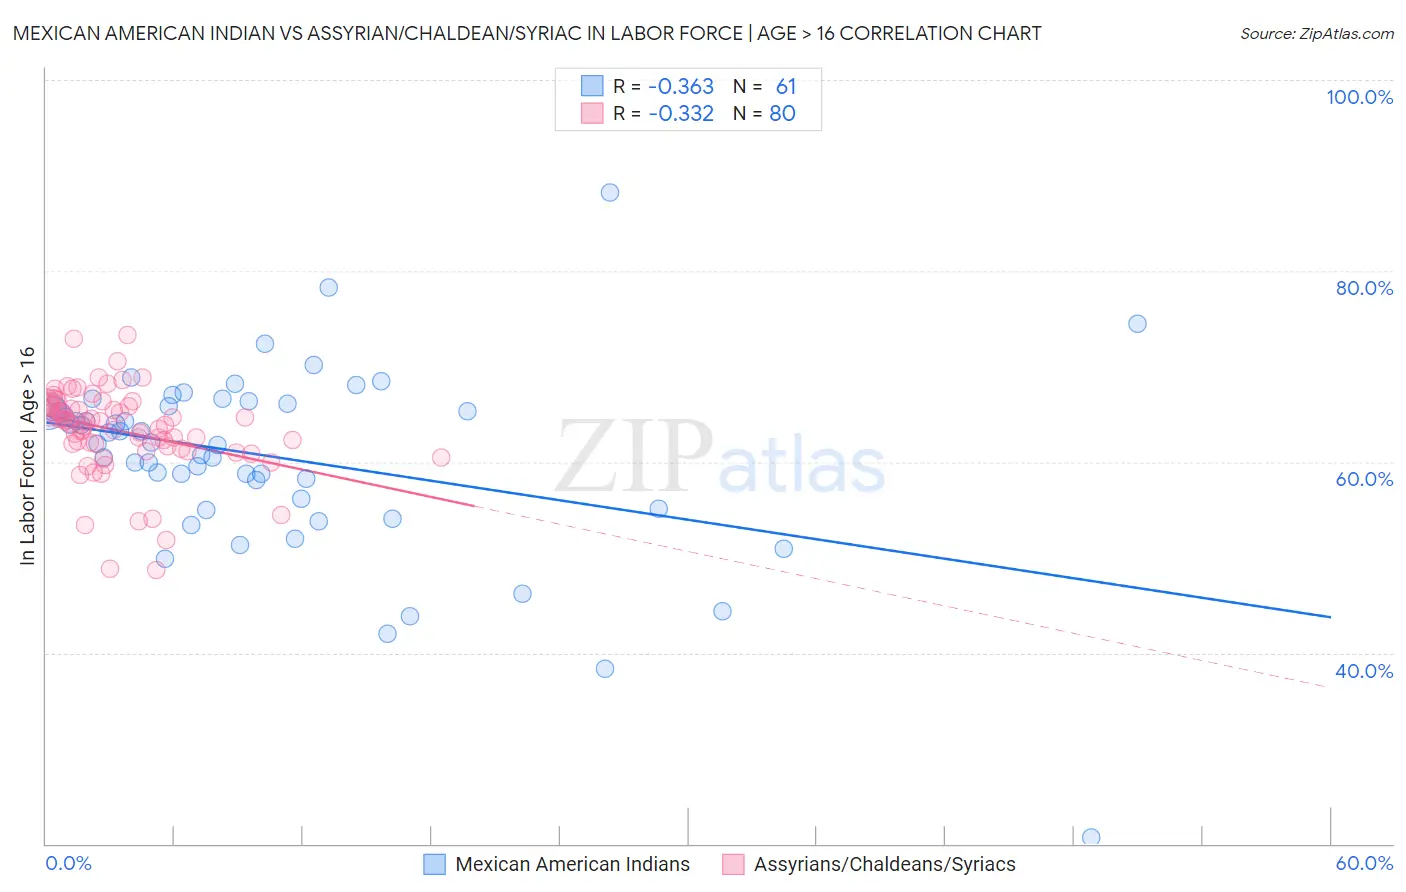
Mexican American Indian vs Assyrian/Chaldean/Syriac In Labor Force | Age > 16 Correlation Chart
The statistical analysis conducted on geographies consisting of 317,603,997 people shows a mild negative correlation between the proportion of Mexican American Indians and labor force participation rate among population ages 16 and over in the United States with a correlation coefficient (R) of -0.363 and weighted average of 64.9%. Similarly, the statistical analysis conducted on geographies consisting of 110,318,125 people shows a mild negative correlation between the proportion of Assyrians/Chaldeans/Syriacs and labor force participation rate among population ages 16 and over in the United States with a correlation coefficient (R) of -0.332 and weighted average of 64.0%, a difference of 1.3%.
In Labor Force | Age > 16 Correlation Summary
| Measurement | Mexican American Indian | Assyrian/Chaldean/Syriac |
| Minimum | 20.7% | 48.7% |
| Maximum | 88.2% | 73.3% |
| Range | 67.5% | 24.6% |
| Mean | 60.5% | 63.3% |
| Median | 62.1% | 64.1% |
| Interquartile 25% (IQ1) | 55.6% | 61.5% |
| Interquartile 75% (IQ3) | 66.0% | 66.0% |
| Interquartile Range (IQR) | 10.3% | 4.5% |
| Standard Deviation (Sample) | 10.0% | 4.6% |
| Standard Deviation (Population) | 9.9% | 4.6% |
Similar Demographics by In Labor Force | Age > 16
Demographics Similar to Mexican American Indians by In Labor Force | Age > 16
In terms of in labor force | age > 16, the demographic groups most similar to Mexican American Indians are Greek (64.9%, a difference of 0.050%), Armenian (64.9%, a difference of 0.050%), Ukrainian (64.9%, a difference of 0.060%), Immigrants from Belgium (64.9%, a difference of 0.060%), and Russian (64.9%, a difference of 0.070%).
| Demographics | Rating | Rank | In Labor Force | Age > 16 |
| Immigrants | Fiji | 33.7 /100 | #192 | Fair 65.0% |
| Immigrants | Europe | 33.6 /100 | #193 | Fair 65.0% |
| Immigrants | Southern Europe | 31.3 /100 | #194 | Fair 65.0% |
| Romanians | 31.1 /100 | #195 | Fair 65.0% |
| Haitians | 30.6 /100 | #196 | Fair 65.0% |
| Immigrants | Italy | 28.7 /100 | #197 | Fair 65.0% |
| Greeks | 26.1 /100 | #198 | Fair 64.9% |
| Mexican American Indians | 23.1 /100 | #199 | Fair 64.9% |
| Armenians | 20.2 /100 | #200 | Fair 64.9% |
| Ukrainians | 19.6 /100 | #201 | Poor 64.9% |
| Immigrants | Belgium | 19.4 /100 | #202 | Poor 64.9% |
| Russians | 18.8 /100 | #203 | Poor 64.9% |
| Slovenes | 18.7 /100 | #204 | Poor 64.9% |
| Jamaicans | 18.7 /100 | #205 | Poor 64.9% |
| Lithuanians | 17.4 /100 | #206 | Poor 64.8% |
Demographics Similar to Assyrians/Chaldeans/Syriacs by In Labor Force | Age > 16
In terms of in labor force | age > 16, the demographic groups most similar to Assyrians/Chaldeans/Syriacs are Immigrants from Bahamas (64.0%, a difference of 0.020%), Welsh (64.0%, a difference of 0.030%), Immigrants from St. Vincent and the Grenadines (64.0%, a difference of 0.040%), French Canadian (64.0%, a difference of 0.040%), and Mexican (64.1%, a difference of 0.050%).
| Demographics | Rating | Rank | In Labor Force | Age > 16 |
| Dominicans | 0.4 /100 | #271 | Tragic 64.1% |
| Native Hawaiians | 0.3 /100 | #272 | Tragic 64.1% |
| Hmong | 0.3 /100 | #273 | Tragic 64.1% |
| Immigrants | Cuba | 0.3 /100 | #274 | Tragic 64.1% |
| Mexicans | 0.3 /100 | #275 | Tragic 64.1% |
| French American Indians | 0.3 /100 | #276 | Tragic 64.1% |
| Immigrants | Bahamas | 0.3 /100 | #277 | Tragic 64.0% |
| Assyrians/Chaldeans/Syriacs | 0.3 /100 | #278 | Tragic 64.0% |
| Welsh | 0.2 /100 | #279 | Tragic 64.0% |
| Immigrants | St. Vincent and the Grenadines | 0.2 /100 | #280 | Tragic 64.0% |
| French Canadians | 0.2 /100 | #281 | Tragic 64.0% |
| Immigrants | Guyana | 0.2 /100 | #282 | Tragic 64.0% |
| Immigrants | Germany | 0.1 /100 | #283 | Tragic 63.9% |
| French | 0.1 /100 | #284 | Tragic 63.9% |
| Slovaks | 0.1 /100 | #285 | Tragic 63.9% |