Immigrants from Albania vs Immigrants from Eastern Asia In Labor Force | Age > 16
COMPARE
Immigrants from Albania
Immigrants from Eastern Asia
In Labor Force | Age > 16
In Labor Force | Age > 16 Comparison
Immigrants from Albania
Immigrants from Eastern Asia
65.4%
IN LABOR FORCE | AGE > 16
85.7/ 100
METRIC RATING
149th/ 347
METRIC RANK
65.7%
IN LABOR FORCE | AGE > 16
94.9/ 100
METRIC RATING
127th/ 347
METRIC RANK
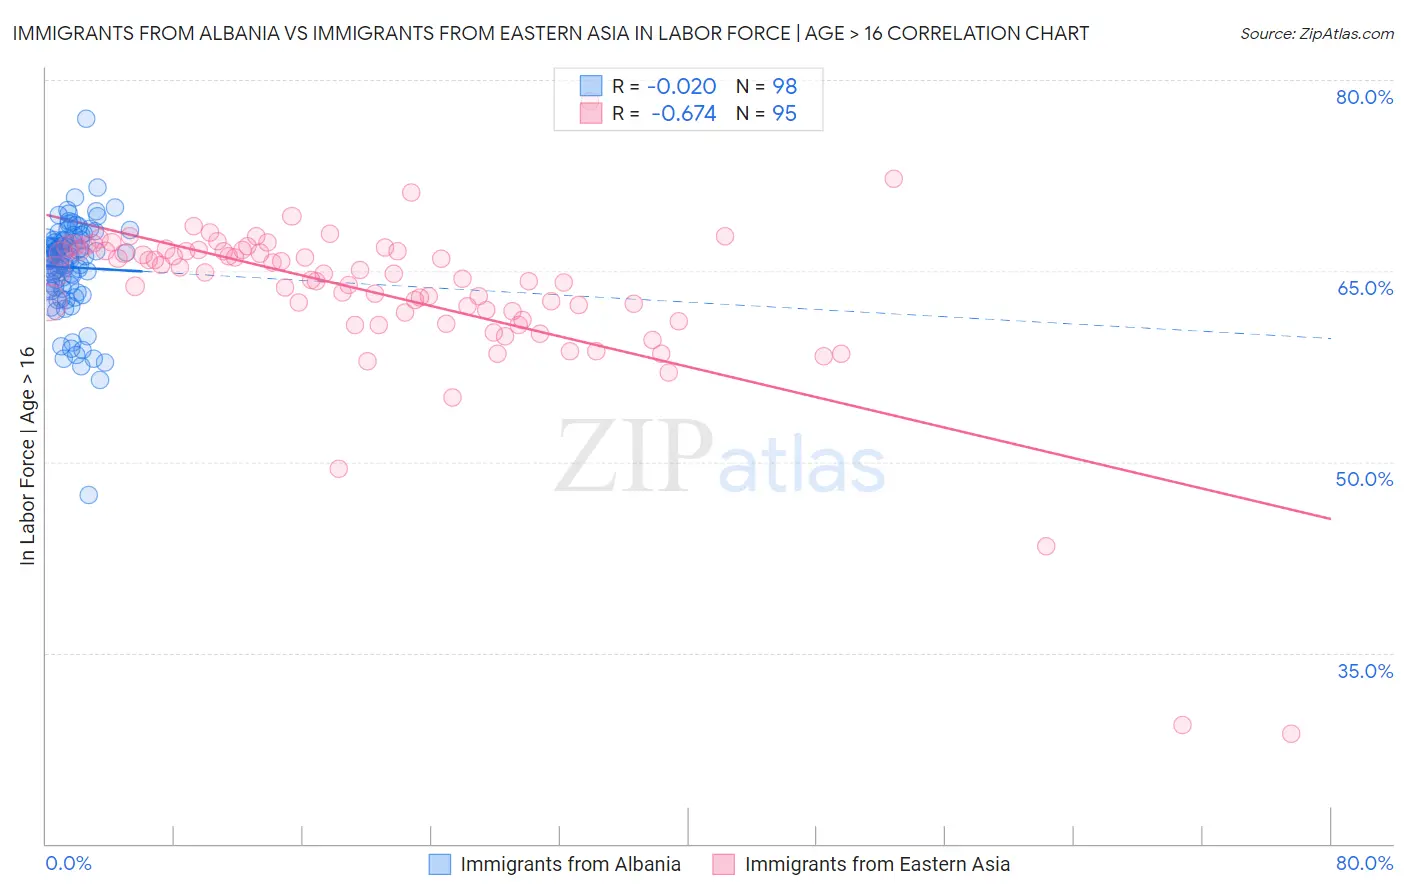
Immigrants from Albania vs Immigrants from Eastern Asia In Labor Force | Age > 16 Correlation Chart
The statistical analysis conducted on geographies consisting of 119,399,287 people shows no correlation between the proportion of Immigrants from Albania and labor force participation rate among population ages 16 and over in the United States with a correlation coefficient (R) of -0.020 and weighted average of 65.4%. Similarly, the statistical analysis conducted on geographies consisting of 499,974,052 people shows a significant negative correlation between the proportion of Immigrants from Eastern Asia and labor force participation rate among population ages 16 and over in the United States with a correlation coefficient (R) of -0.674 and weighted average of 65.7%, a difference of 0.31%.
In Labor Force | Age > 16 Correlation Summary
| Measurement | Immigrants from Albania | Immigrants from Eastern Asia |
| Minimum | 47.4% | 28.6% |
| Maximum | 77.0% | 78.3% |
| Range | 29.6% | 49.7% |
| Mean | 65.3% | 63.3% |
| Median | 66.2% | 64.8% |
| Interquartile 25% (IQ1) | 63.6% | 61.7% |
| Interquartile 75% (IQ3) | 67.4% | 66.6% |
| Interquartile Range (IQR) | 3.8% | 4.9% |
| Standard Deviation (Sample) | 3.9% | 6.7% |
| Standard Deviation (Population) | 3.9% | 6.7% |
Similar Demographics by In Labor Force | Age > 16
Demographics Similar to Immigrants from Albania by In Labor Force | Age > 16
In terms of in labor force | age > 16, the demographic groups most similar to Immigrants from Albania are Bhutanese (65.5%, a difference of 0.010%), Immigrants from Oceania (65.5%, a difference of 0.040%), Cypriot (65.5%, a difference of 0.060%), Immigrants from Romania (65.5%, a difference of 0.070%), and Tlingit-Haida (65.5%, a difference of 0.070%).
| Demographics | Rating | Rank | In Labor Force | Age > 16 |
| Indians (Asian) | 89.5 /100 | #142 | Excellent 65.5% |
| Latvians | 89.4 /100 | #143 | Excellent 65.5% |
| Immigrants | Romania | 88.6 /100 | #144 | Excellent 65.5% |
| Tlingit-Haida | 88.3 /100 | #145 | Excellent 65.5% |
| Cypriots | 88.2 /100 | #146 | Excellent 65.5% |
| Immigrants | Oceania | 87.5 /100 | #147 | Excellent 65.5% |
| Bhutanese | 86.3 /100 | #148 | Excellent 65.5% |
| Immigrants | Albania | 85.7 /100 | #149 | Excellent 65.4% |
| Immigrants | Immigrants | 81.9 /100 | #150 | Excellent 65.4% |
| Czechs | 81.5 /100 | #151 | Excellent 65.4% |
| Yugoslavians | 81.3 /100 | #152 | Excellent 65.4% |
| Immigrants | China | 80.5 /100 | #153 | Excellent 65.4% |
| Immigrants | Eastern Europe | 78.3 /100 | #154 | Good 65.4% |
| Immigrants | Armenia | 76.6 /100 | #155 | Good 65.3% |
| Immigrants | Ireland | 75.9 /100 | #156 | Good 65.3% |
Demographics Similar to Immigrants from Eastern Asia by In Labor Force | Age > 16
In terms of in labor force | age > 16, the demographic groups most similar to Immigrants from Eastern Asia are Ecuadorian (65.6%, a difference of 0.010%), Korean (65.7%, a difference of 0.020%), Immigrants from Philippines (65.6%, a difference of 0.020%), Iraqi (65.7%, a difference of 0.030%), and Norwegian (65.7%, a difference of 0.030%).
| Demographics | Rating | Rank | In Labor Force | Age > 16 |
| Immigrants | Hong Kong | 96.2 /100 | #120 | Exceptional 65.7% |
| New Zealanders | 96.0 /100 | #121 | Exceptional 65.7% |
| Immigrants | Ecuador | 95.9 /100 | #122 | Exceptional 65.7% |
| Immigrants | Iraq | 95.5 /100 | #123 | Exceptional 65.7% |
| Iraqis | 95.4 /100 | #124 | Exceptional 65.7% |
| Norwegians | 95.3 /100 | #125 | Exceptional 65.7% |
| Koreans | 95.3 /100 | #126 | Exceptional 65.7% |
| Immigrants | Eastern Asia | 94.9 /100 | #127 | Exceptional 65.7% |
| Ecuadorians | 94.7 /100 | #128 | Exceptional 65.6% |
| Immigrants | Philippines | 94.5 /100 | #129 | Exceptional 65.6% |
| Immigrants | Guatemala | 94.4 /100 | #130 | Exceptional 65.6% |
| Icelanders | 94.3 /100 | #131 | Exceptional 65.6% |
| Immigrants | North Macedonia | 94.1 /100 | #132 | Exceptional 65.6% |
| Immigrants | Lithuania | 93.5 /100 | #133 | Exceptional 65.6% |
| Costa Ricans | 93.2 /100 | #134 | Exceptional 65.6% |