Fijian vs Immigrants from Eastern Asia In Labor Force | Age > 16
COMPARE
Fijian
Immigrants from Eastern Asia
In Labor Force | Age > 16
In Labor Force | Age > 16 Comparison
Fijians
Immigrants from Eastern Asia
64.8%
IN LABOR FORCE | AGE > 16
14.1/ 100
METRIC RATING
211th/ 347
METRIC RANK
65.7%
IN LABOR FORCE | AGE > 16
94.9/ 100
METRIC RATING
127th/ 347
METRIC RANK
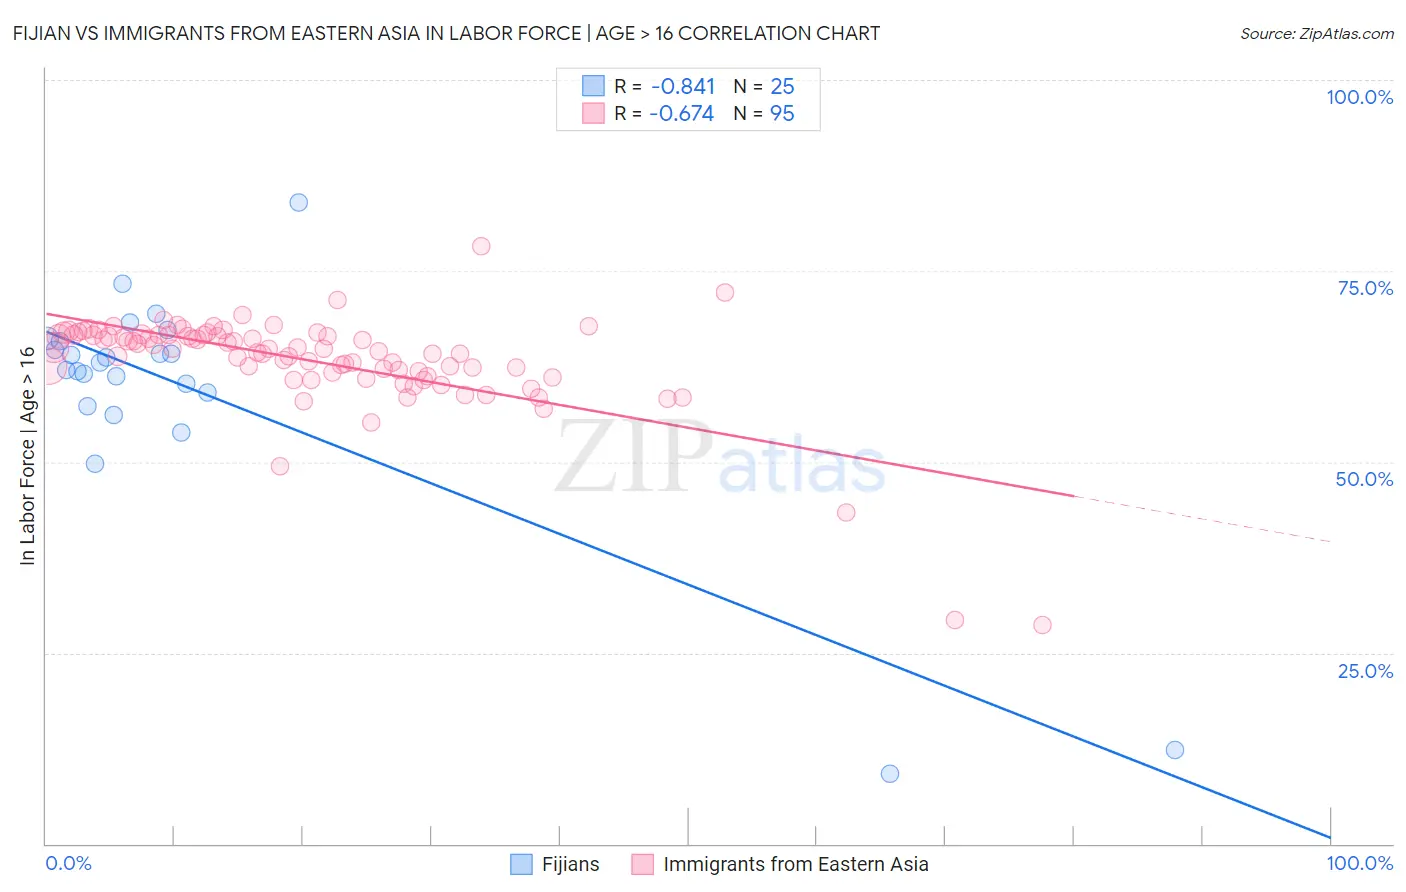
Fijian vs Immigrants from Eastern Asia In Labor Force | Age > 16 Correlation Chart
The statistical analysis conducted on geographies consisting of 55,948,069 people shows a very strong negative correlation between the proportion of Fijians and labor force participation rate among population ages 16 and over in the United States with a correlation coefficient (R) of -0.841 and weighted average of 64.8%. Similarly, the statistical analysis conducted on geographies consisting of 499,974,052 people shows a significant negative correlation between the proportion of Immigrants from Eastern Asia and labor force participation rate among population ages 16 and over in the United States with a correlation coefficient (R) of -0.674 and weighted average of 65.7%, a difference of 1.3%.
In Labor Force | Age > 16 Correlation Summary
| Measurement | Fijian | Immigrants from Eastern Asia |
| Minimum | 9.1% | 28.6% |
| Maximum | 83.9% | 78.3% |
| Range | 74.8% | 49.7% |
| Mean | 59.3% | 63.3% |
| Median | 63.0% | 64.8% |
| Interquartile 25% (IQ1) | 58.2% | 61.7% |
| Interquartile 75% (IQ3) | 66.0% | 66.6% |
| Interquartile Range (IQR) | 7.7% | 4.9% |
| Standard Deviation (Sample) | 16.0% | 6.7% |
| Standard Deviation (Population) | 15.7% | 6.7% |
Similar Demographics by In Labor Force | Age > 16
Demographics Similar to Fijians by In Labor Force | Age > 16
In terms of in labor force | age > 16, the demographic groups most similar to Fijians are Immigrants from Denmark (64.8%, a difference of 0.010%), Alaskan Athabascan (64.8%, a difference of 0.010%), Maltese (64.8%, a difference of 0.010%), Estonian (64.8%, a difference of 0.020%), and Immigrants from Trinidad and Tobago (64.8%, a difference of 0.030%).
| Demographics | Rating | Rank | In Labor Force | Age > 16 |
| Slovenes | 18.7 /100 | #204 | Poor 64.9% |
| Jamaicans | 18.7 /100 | #205 | Poor 64.9% |
| Lithuanians | 17.4 /100 | #206 | Poor 64.8% |
| Immigrants | Latin America | 16.4 /100 | #207 | Poor 64.8% |
| Belizeans | 16.2 /100 | #208 | Poor 64.8% |
| Immigrants | Trinidad and Tobago | 15.6 /100 | #209 | Poor 64.8% |
| Immigrants | Denmark | 14.7 /100 | #210 | Poor 64.8% |
| Fijians | 14.1 /100 | #211 | Poor 64.8% |
| Alaskan Athabascans | 13.9 /100 | #212 | Poor 64.8% |
| Maltese | 13.8 /100 | #213 | Poor 64.8% |
| Estonians | 13.1 /100 | #214 | Poor 64.8% |
| Immigrants | Czechoslovakia | 12.3 /100 | #215 | Poor 64.8% |
| Belgians | 11.4 /100 | #216 | Poor 64.7% |
| U.S. Virgin Islanders | 11.3 /100 | #217 | Poor 64.7% |
| Alsatians | 10.7 /100 | #218 | Poor 64.7% |
Demographics Similar to Immigrants from Eastern Asia by In Labor Force | Age > 16
In terms of in labor force | age > 16, the demographic groups most similar to Immigrants from Eastern Asia are Ecuadorian (65.6%, a difference of 0.010%), Korean (65.7%, a difference of 0.020%), Immigrants from Philippines (65.6%, a difference of 0.020%), Iraqi (65.7%, a difference of 0.030%), and Norwegian (65.7%, a difference of 0.030%).
| Demographics | Rating | Rank | In Labor Force | Age > 16 |
| Immigrants | Hong Kong | 96.2 /100 | #120 | Exceptional 65.7% |
| New Zealanders | 96.0 /100 | #121 | Exceptional 65.7% |
| Immigrants | Ecuador | 95.9 /100 | #122 | Exceptional 65.7% |
| Immigrants | Iraq | 95.5 /100 | #123 | Exceptional 65.7% |
| Iraqis | 95.4 /100 | #124 | Exceptional 65.7% |
| Norwegians | 95.3 /100 | #125 | Exceptional 65.7% |
| Koreans | 95.3 /100 | #126 | Exceptional 65.7% |
| Immigrants | Eastern Asia | 94.9 /100 | #127 | Exceptional 65.7% |
| Ecuadorians | 94.7 /100 | #128 | Exceptional 65.6% |
| Immigrants | Philippines | 94.5 /100 | #129 | Exceptional 65.6% |
| Immigrants | Guatemala | 94.4 /100 | #130 | Exceptional 65.6% |
| Icelanders | 94.3 /100 | #131 | Exceptional 65.6% |
| Immigrants | North Macedonia | 94.1 /100 | #132 | Exceptional 65.6% |
| Immigrants | Lithuania | 93.5 /100 | #133 | Exceptional 65.6% |
| Costa Ricans | 93.2 /100 | #134 | Exceptional 65.6% |