Immigrants from Zimbabwe vs Kiowa In Labor Force | Age > 16
COMPARE
Immigrants from Zimbabwe
Kiowa
In Labor Force | Age > 16
In Labor Force | Age > 16 Comparison
Immigrants from Zimbabwe
Kiowa
66.8%
IN LABOR FORCE | AGE > 16
100.0/ 100
METRIC RATING
41st/ 347
METRIC RANK
62.4%
IN LABOR FORCE | AGE > 16
0.0/ 100
METRIC RATING
317th/ 347
METRIC RANK
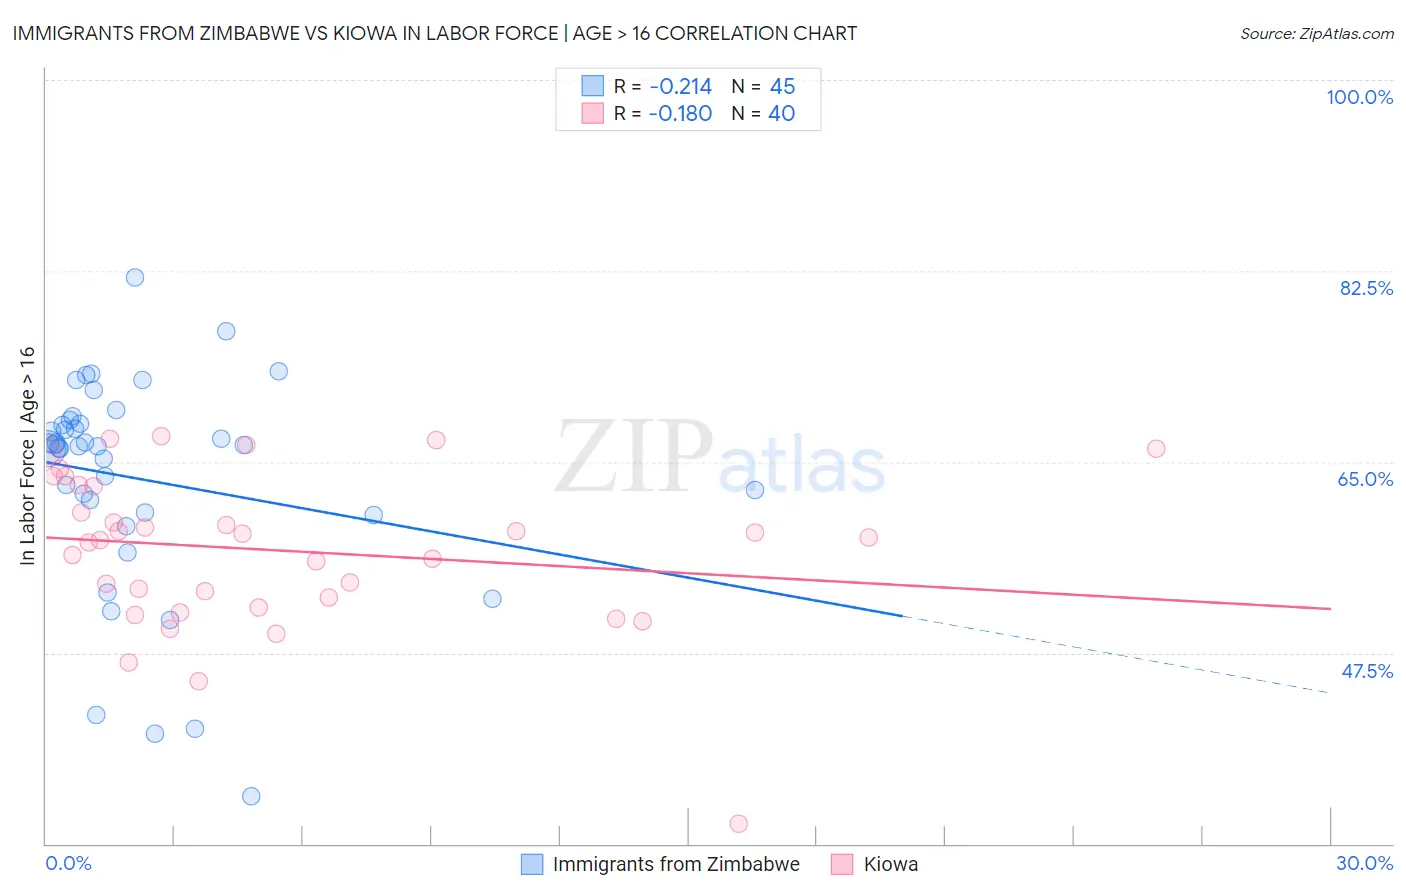
Immigrants from Zimbabwe vs Kiowa In Labor Force | Age > 16 Correlation Chart
The statistical analysis conducted on geographies consisting of 117,813,757 people shows a weak negative correlation between the proportion of Immigrants from Zimbabwe and labor force participation rate among population ages 16 and over in the United States with a correlation coefficient (R) of -0.214 and weighted average of 66.8%. Similarly, the statistical analysis conducted on geographies consisting of 56,099,156 people shows a poor negative correlation between the proportion of Kiowa and labor force participation rate among population ages 16 and over in the United States with a correlation coefficient (R) of -0.180 and weighted average of 62.4%, a difference of 7.0%.
In Labor Force | Age > 16 Correlation Summary
| Measurement | Immigrants from Zimbabwe | Kiowa |
| Minimum | 34.4% | 31.8% |
| Maximum | 81.9% | 67.3% |
| Range | 47.5% | 35.5% |
| Mean | 63.4% | 56.9% |
| Median | 66.5% | 58.0% |
| Interquartile 25% (IQ1) | 60.2% | 52.1% |
| Interquartile 75% (IQ3) | 68.7% | 62.8% |
| Interquartile Range (IQR) | 8.5% | 10.7% |
| Standard Deviation (Sample) | 10.0% | 7.3% |
| Standard Deviation (Population) | 9.9% | 7.2% |
Similar Demographics by In Labor Force | Age > 16
Demographics Similar to Immigrants from Zimbabwe by In Labor Force | Age > 16
In terms of in labor force | age > 16, the demographic groups most similar to Immigrants from Zimbabwe are Immigrants from El Salvador (66.8%, a difference of 0.0%), Salvadoran (66.8%, a difference of 0.020%), Senegalese (66.7%, a difference of 0.10%), Luxembourger (66.7%, a difference of 0.12%), and Immigrants from Nigeria (66.9%, a difference of 0.17%).
| Demographics | Rating | Rank | In Labor Force | Age > 16 |
| Immigrants | Ghana | 100.0 /100 | #34 | Exceptional 67.1% |
| Immigrants | South Central Asia | 100.0 /100 | #35 | Exceptional 67.1% |
| Immigrants | Western Africa | 100.0 /100 | #36 | Exceptional 67.1% |
| Immigrants | Afghanistan | 100.0 /100 | #37 | Exceptional 67.0% |
| Immigrants | Nigeria | 100.0 /100 | #38 | Exceptional 66.9% |
| Salvadorans | 100.0 /100 | #39 | Exceptional 66.8% |
| Immigrants | El Salvador | 100.0 /100 | #40 | Exceptional 66.8% |
| Immigrants | Zimbabwe | 100.0 /100 | #41 | Exceptional 66.8% |
| Senegalese | 100.0 /100 | #42 | Exceptional 66.7% |
| Luxembourgers | 100.0 /100 | #43 | Exceptional 66.7% |
| Immigrants | Pakistan | 100.0 /100 | #44 | Exceptional 66.7% |
| Immigrants | Brazil | 100.0 /100 | #45 | Exceptional 66.7% |
| Brazilians | 100.0 /100 | #46 | Exceptional 66.6% |
| Immigrants | Bulgaria | 100.0 /100 | #47 | Exceptional 66.6% |
| Nigerians | 100.0 /100 | #48 | Exceptional 66.6% |
Demographics Similar to Kiowa by In Labor Force | Age > 16
In terms of in labor force | age > 16, the demographic groups most similar to Kiowa are Chickasaw (62.3%, a difference of 0.19%), Arapaho (62.1%, a difference of 0.44%), Yakama (62.1%, a difference of 0.44%), Yup'ik (62.7%, a difference of 0.45%), and American (62.1%, a difference of 0.47%).
| Demographics | Rating | Rank | In Labor Force | Age > 16 |
| Shoshone | 0.0 /100 | #310 | Tragic 63.2% |
| Blackfeet | 0.0 /100 | #311 | Tragic 63.2% |
| Iroquois | 0.0 /100 | #312 | Tragic 63.2% |
| Chippewa | 0.0 /100 | #313 | Tragic 63.1% |
| Yaqui | 0.0 /100 | #314 | Tragic 63.0% |
| Potawatomi | 0.0 /100 | #315 | Tragic 62.8% |
| Yup'ik | 0.0 /100 | #316 | Tragic 62.7% |
| Kiowa | 0.0 /100 | #317 | Tragic 62.4% |
| Chickasaw | 0.0 /100 | #318 | Tragic 62.3% |
| Arapaho | 0.0 /100 | #319 | Tragic 62.1% |
| Yakama | 0.0 /100 | #320 | Tragic 62.1% |
| Americans | 0.0 /100 | #321 | Tragic 62.1% |
| Ottawa | 0.0 /100 | #322 | Tragic 62.0% |
| Seminole | 0.0 /100 | #323 | Tragic 62.0% |
| Cheyenne | 0.0 /100 | #324 | Tragic 62.0% |