Israeli vs Kiowa In Labor Force | Age > 16
COMPARE
Israeli
Kiowa
In Labor Force | Age > 16
In Labor Force | Age > 16 Comparison
Israelis
Kiowa
65.2%
IN LABOR FORCE | AGE > 16
61.6/ 100
METRIC RATING
171st/ 347
METRIC RANK
62.4%
IN LABOR FORCE | AGE > 16
0.0/ 100
METRIC RATING
317th/ 347
METRIC RANK
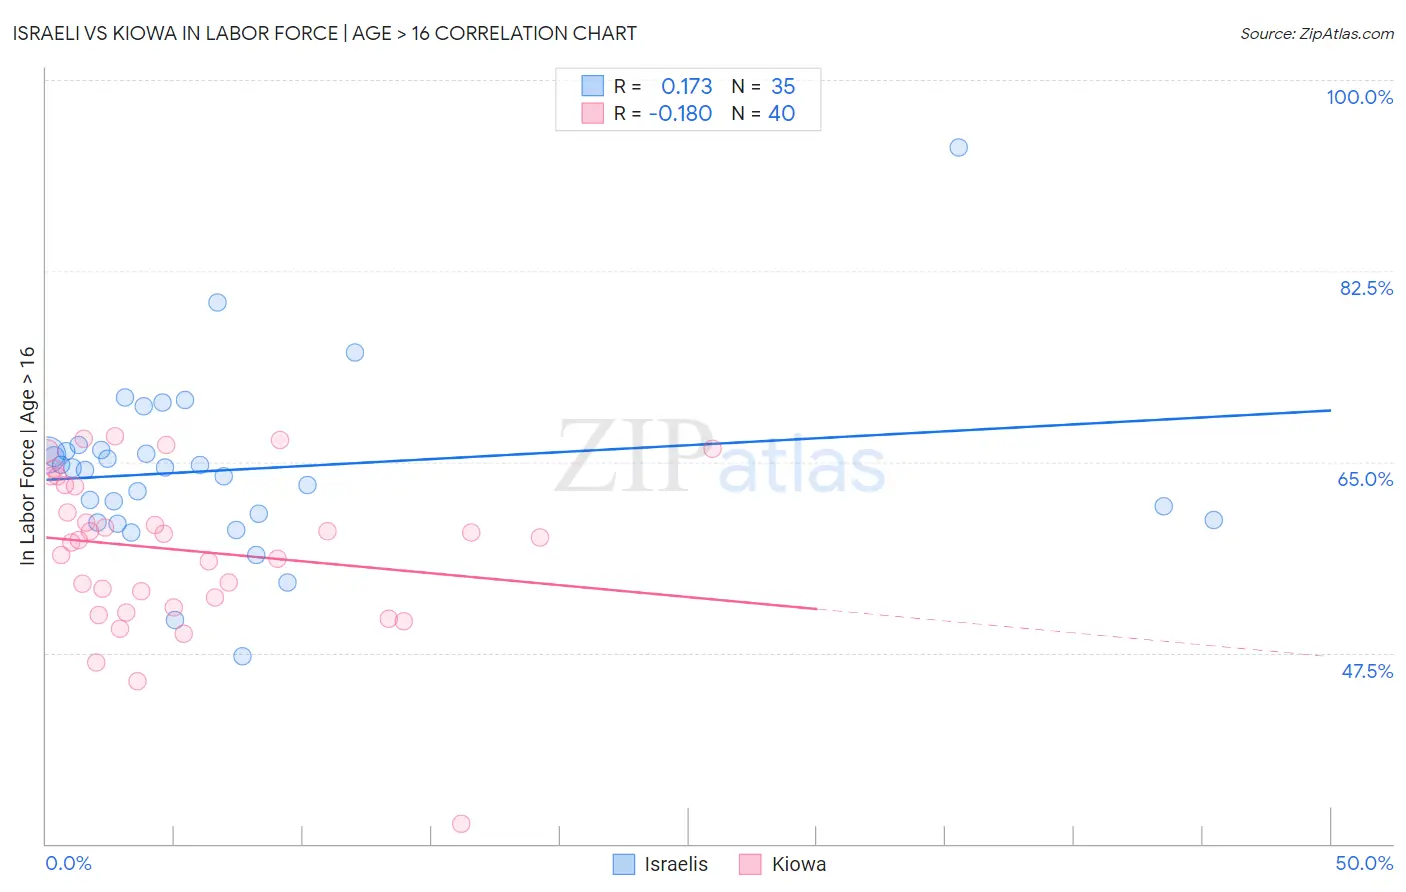
Israeli vs Kiowa In Labor Force | Age > 16 Correlation Chart
The statistical analysis conducted on geographies consisting of 211,218,768 people shows a poor positive correlation between the proportion of Israelis and labor force participation rate among population ages 16 and over in the United States with a correlation coefficient (R) of 0.173 and weighted average of 65.2%. Similarly, the statistical analysis conducted on geographies consisting of 56,099,156 people shows a poor negative correlation between the proportion of Kiowa and labor force participation rate among population ages 16 and over in the United States with a correlation coefficient (R) of -0.180 and weighted average of 62.4%, a difference of 4.5%.
In Labor Force | Age > 16 Correlation Summary
| Measurement | Israeli | Kiowa |
| Minimum | 47.2% | 31.8% |
| Maximum | 93.8% | 67.3% |
| Range | 46.6% | 35.5% |
| Mean | 64.3% | 56.9% |
| Median | 64.4% | 58.0% |
| Interquartile 25% (IQ1) | 59.7% | 52.1% |
| Interquartile 75% (IQ3) | 66.1% | 62.8% |
| Interquartile Range (IQR) | 6.4% | 10.7% |
| Standard Deviation (Sample) | 8.1% | 7.3% |
| Standard Deviation (Population) | 8.0% | 7.2% |
Similar Demographics by In Labor Force | Age > 16
Demographics Similar to Israelis by In Labor Force | Age > 16
In terms of in labor force | age > 16, the demographic groups most similar to Israelis are Immigrants from Israel (65.2%, a difference of 0.0%), Immigrants from Sweden (65.2%, a difference of 0.0%), Arab (65.2%, a difference of 0.010%), Serbian (65.2%, a difference of 0.020%), and Immigrants from Belarus (65.2%, a difference of 0.050%).
| Demographics | Rating | Rank | In Labor Force | Age > 16 |
| Danes | 68.8 /100 | #164 | Good 65.3% |
| Immigrants | Kazakhstan | 68.1 /100 | #165 | Good 65.3% |
| Immigrants | Western Asia | 67.3 /100 | #166 | Good 65.3% |
| Immigrants | Belarus | 66.0 /100 | #167 | Good 65.2% |
| Serbians | 63.5 /100 | #168 | Good 65.2% |
| Arabs | 62.4 /100 | #169 | Good 65.2% |
| Immigrants | Israel | 61.7 /100 | #170 | Good 65.2% |
| Israelis | 61.6 /100 | #171 | Good 65.2% |
| Immigrants | Sweden | 61.3 /100 | #172 | Good 65.2% |
| Immigrants | Ukraine | 53.7 /100 | #173 | Average 65.1% |
| Macedonians | 50.0 /100 | #174 | Average 65.1% |
| Nicaraguans | 49.7 /100 | #175 | Average 65.1% |
| Swedes | 47.4 /100 | #176 | Average 65.1% |
| Eastern Europeans | 46.2 /100 | #177 | Average 65.1% |
| Trinidadians and Tobagonians | 45.2 /100 | #178 | Average 65.1% |
Demographics Similar to Kiowa by In Labor Force | Age > 16
In terms of in labor force | age > 16, the demographic groups most similar to Kiowa are Chickasaw (62.3%, a difference of 0.19%), Arapaho (62.1%, a difference of 0.44%), Yakama (62.1%, a difference of 0.44%), Yup'ik (62.7%, a difference of 0.45%), and American (62.1%, a difference of 0.47%).
| Demographics | Rating | Rank | In Labor Force | Age > 16 |
| Shoshone | 0.0 /100 | #310 | Tragic 63.2% |
| Blackfeet | 0.0 /100 | #311 | Tragic 63.2% |
| Iroquois | 0.0 /100 | #312 | Tragic 63.2% |
| Chippewa | 0.0 /100 | #313 | Tragic 63.1% |
| Yaqui | 0.0 /100 | #314 | Tragic 63.0% |
| Potawatomi | 0.0 /100 | #315 | Tragic 62.8% |
| Yup'ik | 0.0 /100 | #316 | Tragic 62.7% |
| Kiowa | 0.0 /100 | #317 | Tragic 62.4% |
| Chickasaw | 0.0 /100 | #318 | Tragic 62.3% |
| Arapaho | 0.0 /100 | #319 | Tragic 62.1% |
| Yakama | 0.0 /100 | #320 | Tragic 62.1% |
| Americans | 0.0 /100 | #321 | Tragic 62.1% |
| Ottawa | 0.0 /100 | #322 | Tragic 62.0% |
| Seminole | 0.0 /100 | #323 | Tragic 62.0% |
| Cheyenne | 0.0 /100 | #324 | Tragic 62.0% |