Immigrants from Zimbabwe vs Immigrants from Kazakhstan In Labor Force | Age > 16
COMPARE
Immigrants from Zimbabwe
Immigrants from Kazakhstan
In Labor Force | Age > 16
In Labor Force | Age > 16 Comparison
Immigrants from Zimbabwe
Immigrants from Kazakhstan
66.8%
IN LABOR FORCE | AGE > 16
100.0/ 100
METRIC RATING
41st/ 347
METRIC RANK
65.3%
IN LABOR FORCE | AGE > 16
68.1/ 100
METRIC RATING
165th/ 347
METRIC RANK
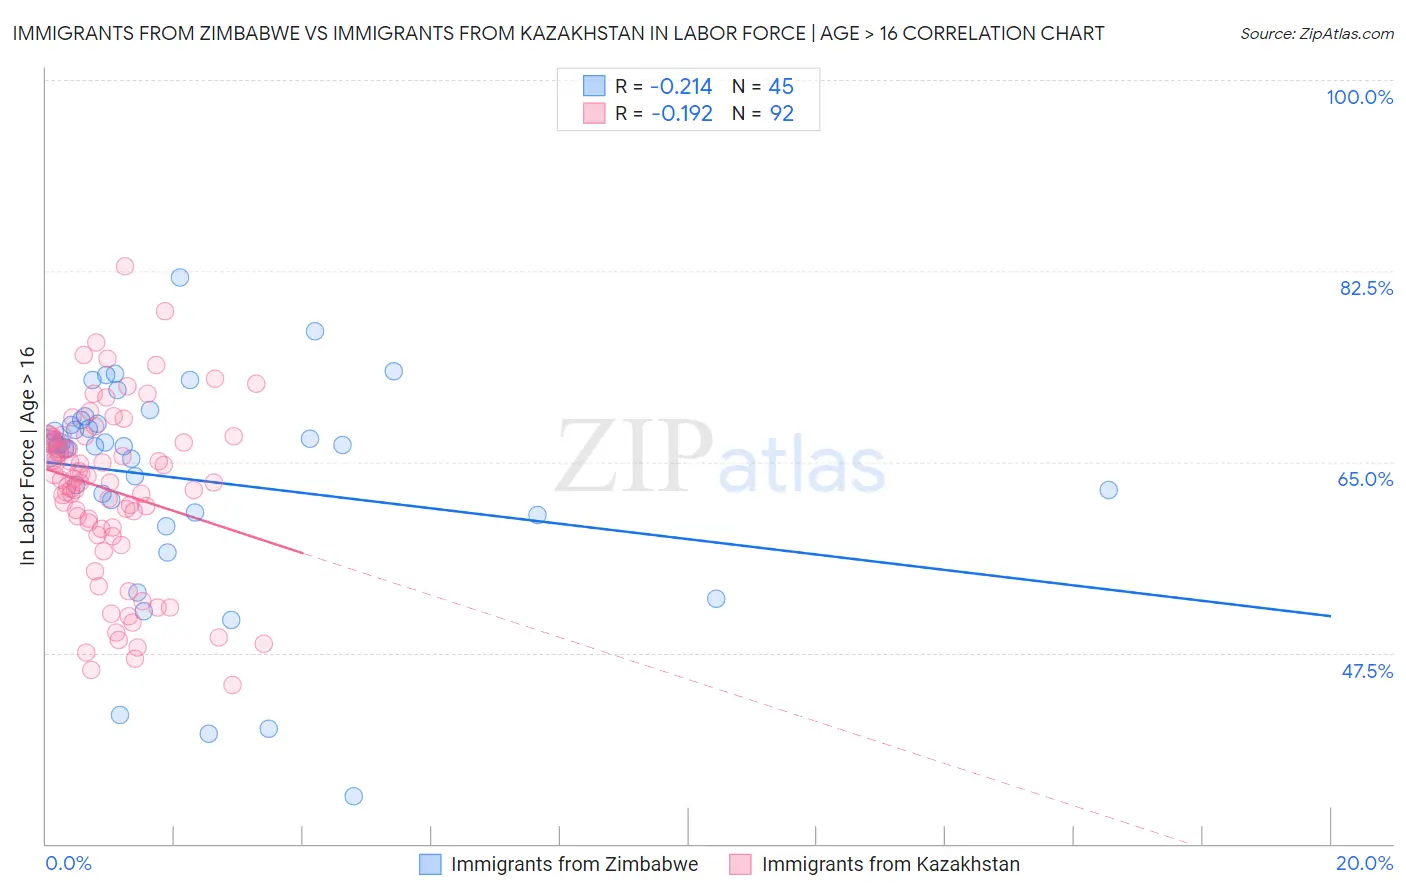
Immigrants from Zimbabwe vs Immigrants from Kazakhstan In Labor Force | Age > 16 Correlation Chart
The statistical analysis conducted on geographies consisting of 117,813,757 people shows a weak negative correlation between the proportion of Immigrants from Zimbabwe and labor force participation rate among population ages 16 and over in the United States with a correlation coefficient (R) of -0.214 and weighted average of 66.8%. Similarly, the statistical analysis conducted on geographies consisting of 124,444,172 people shows a poor negative correlation between the proportion of Immigrants from Kazakhstan and labor force participation rate among population ages 16 and over in the United States with a correlation coefficient (R) of -0.192 and weighted average of 65.3%, a difference of 2.4%.
In Labor Force | Age > 16 Correlation Summary
| Measurement | Immigrants from Zimbabwe | Immigrants from Kazakhstan |
| Minimum | 34.4% | 44.6% |
| Maximum | 81.9% | 82.9% |
| Range | 47.5% | 38.3% |
| Mean | 63.4% | 62.4% |
| Median | 66.5% | 63.4% |
| Interquartile 25% (IQ1) | 60.2% | 58.9% |
| Interquartile 75% (IQ3) | 68.7% | 67.1% |
| Interquartile Range (IQR) | 8.5% | 8.1% |
| Standard Deviation (Sample) | 10.0% | 7.8% |
| Standard Deviation (Population) | 9.9% | 7.7% |
Similar Demographics by In Labor Force | Age > 16
Demographics Similar to Immigrants from Zimbabwe by In Labor Force | Age > 16
In terms of in labor force | age > 16, the demographic groups most similar to Immigrants from Zimbabwe are Immigrants from El Salvador (66.8%, a difference of 0.0%), Salvadoran (66.8%, a difference of 0.020%), Senegalese (66.7%, a difference of 0.10%), Luxembourger (66.7%, a difference of 0.12%), and Immigrants from Nigeria (66.9%, a difference of 0.17%).
| Demographics | Rating | Rank | In Labor Force | Age > 16 |
| Immigrants | Ghana | 100.0 /100 | #34 | Exceptional 67.1% |
| Immigrants | South Central Asia | 100.0 /100 | #35 | Exceptional 67.1% |
| Immigrants | Western Africa | 100.0 /100 | #36 | Exceptional 67.1% |
| Immigrants | Afghanistan | 100.0 /100 | #37 | Exceptional 67.0% |
| Immigrants | Nigeria | 100.0 /100 | #38 | Exceptional 66.9% |
| Salvadorans | 100.0 /100 | #39 | Exceptional 66.8% |
| Immigrants | El Salvador | 100.0 /100 | #40 | Exceptional 66.8% |
| Immigrants | Zimbabwe | 100.0 /100 | #41 | Exceptional 66.8% |
| Senegalese | 100.0 /100 | #42 | Exceptional 66.7% |
| Luxembourgers | 100.0 /100 | #43 | Exceptional 66.7% |
| Immigrants | Pakistan | 100.0 /100 | #44 | Exceptional 66.7% |
| Immigrants | Brazil | 100.0 /100 | #45 | Exceptional 66.7% |
| Brazilians | 100.0 /100 | #46 | Exceptional 66.6% |
| Immigrants | Bulgaria | 100.0 /100 | #47 | Exceptional 66.6% |
| Nigerians | 100.0 /100 | #48 | Exceptional 66.6% |
Demographics Similar to Immigrants from Kazakhstan by In Labor Force | Age > 16
In terms of in labor force | age > 16, the demographic groups most similar to Immigrants from Kazakhstan are Danish (65.3%, a difference of 0.010%), Immigrants from Western Asia (65.3%, a difference of 0.010%), South African (65.3%, a difference of 0.020%), Immigrants from Belarus (65.2%, a difference of 0.030%), and Australian (65.3%, a difference of 0.040%).
| Demographics | Rating | Rank | In Labor Force | Age > 16 |
| Panamanians | 75.2 /100 | #158 | Good 65.3% |
| Immigrants | Syria | 74.6 /100 | #159 | Good 65.3% |
| Immigrants | South Africa | 73.5 /100 | #160 | Good 65.3% |
| Australians | 71.3 /100 | #161 | Good 65.3% |
| Albanians | 70.8 /100 | #162 | Good 65.3% |
| South Africans | 69.8 /100 | #163 | Good 65.3% |
| Danes | 68.8 /100 | #164 | Good 65.3% |
| Immigrants | Kazakhstan | 68.1 /100 | #165 | Good 65.3% |
| Immigrants | Western Asia | 67.3 /100 | #166 | Good 65.3% |
| Immigrants | Belarus | 66.0 /100 | #167 | Good 65.2% |
| Serbians | 63.5 /100 | #168 | Good 65.2% |
| Arabs | 62.4 /100 | #169 | Good 65.2% |
| Immigrants | Israel | 61.7 /100 | #170 | Good 65.2% |
| Israelis | 61.6 /100 | #171 | Good 65.2% |
| Immigrants | Sweden | 61.3 /100 | #172 | Good 65.2% |