Immigrants from Zimbabwe vs Kiowa 12th Grade, No Diploma
COMPARE
Immigrants from Zimbabwe
Kiowa
12th Grade, No Diploma
12th Grade, No Diploma Comparison
Immigrants from Zimbabwe
Kiowa
92.1%
12TH GRADE, NO DIPLOMA
96.5/ 100
METRIC RATING
113th/ 347
METRIC RANK
90.0%
12TH GRADE, NO DIPLOMA
1.7/ 100
METRIC RATING
240th/ 347
METRIC RANK
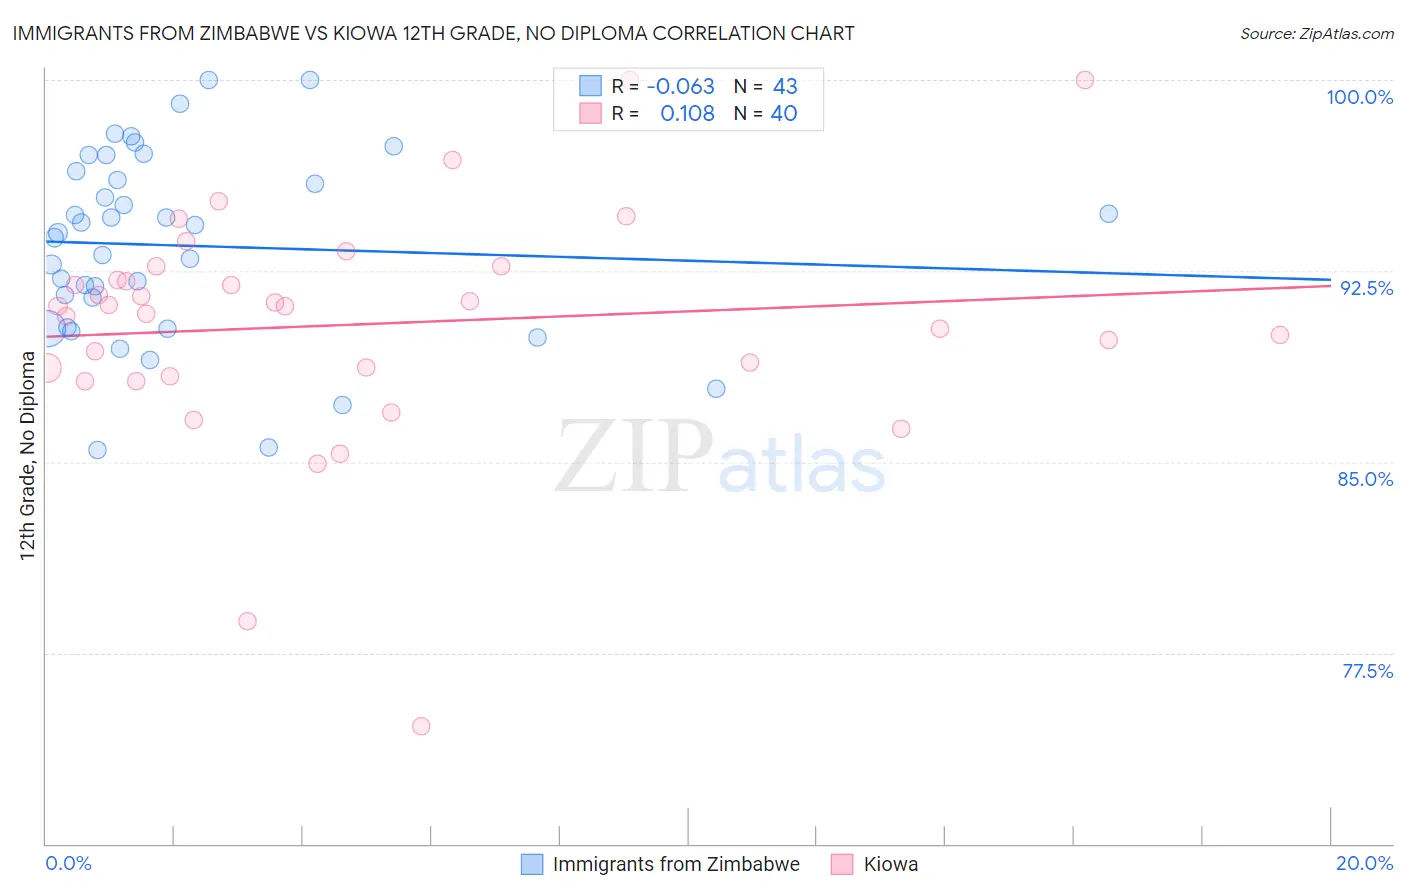
Immigrants from Zimbabwe vs Kiowa 12th Grade, No Diploma Correlation Chart
The statistical analysis conducted on geographies consisting of 117,809,656 people shows a slight negative correlation between the proportion of Immigrants from Zimbabwe and percentage of population with at least 12th grade (no diploma) education in the United States with a correlation coefficient (R) of -0.063 and weighted average of 92.1%. Similarly, the statistical analysis conducted on geographies consisting of 56,101,759 people shows a poor positive correlation between the proportion of Kiowa and percentage of population with at least 12th grade (no diploma) education in the United States with a correlation coefficient (R) of 0.108 and weighted average of 90.0%, a difference of 2.3%.
12th Grade, No Diploma Correlation Summary
| Measurement | Immigrants from Zimbabwe | Kiowa |
| Minimum | 85.5% | 74.6% |
| Maximum | 100.0% | 100.0% |
| Range | 14.5% | 25.4% |
| Mean | 93.5% | 90.4% |
| Median | 94.0% | 91.1% |
| Interquartile 25% (IQ1) | 90.3% | 88.5% |
| Interquartile 75% (IQ3) | 96.4% | 92.4% |
| Interquartile Range (IQR) | 6.1% | 3.9% |
| Standard Deviation (Sample) | 3.7% | 4.6% |
| Standard Deviation (Population) | 3.6% | 4.6% |
Similar Demographics by 12th Grade, No Diploma
Demographics Similar to Immigrants from Zimbabwe by 12th Grade, No Diploma
In terms of 12th grade, no diploma, the demographic groups most similar to Immigrants from Zimbabwe are Yugoslavian (92.1%, a difference of 0.0%), Immigrants from Sri Lanka (92.1%, a difference of 0.010%), Aleut (92.1%, a difference of 0.010%), Immigrants from Eastern Europe (92.1%, a difference of 0.020%), and Israeli (92.1%, a difference of 0.030%).
| Demographics | Rating | Rank | 12th Grade, No Diploma |
| Immigrants | Russia | 97.3 /100 | #106 | Exceptional 92.2% |
| Syrians | 97.2 /100 | #107 | Exceptional 92.2% |
| Jordanians | 97.2 /100 | #108 | Exceptional 92.2% |
| Immigrants | Hungary | 97.0 /100 | #109 | Exceptional 92.1% |
| Palestinians | 97.0 /100 | #110 | Exceptional 92.1% |
| Immigrants | Greece | 96.9 /100 | #111 | Exceptional 92.1% |
| Israelis | 96.8 /100 | #112 | Exceptional 92.1% |
| Immigrants | Zimbabwe | 96.5 /100 | #113 | Exceptional 92.1% |
| Yugoslavians | 96.5 /100 | #114 | Exceptional 92.1% |
| Immigrants | Sri Lanka | 96.4 /100 | #115 | Exceptional 92.1% |
| Aleuts | 96.3 /100 | #116 | Exceptional 92.1% |
| Immigrants | Eastern Europe | 96.3 /100 | #117 | Exceptional 92.1% |
| Puget Sound Salish | 95.8 /100 | #118 | Exceptional 92.0% |
| Immigrants | Germany | 95.5 /100 | #119 | Exceptional 92.0% |
| Immigrants | Kazakhstan | 94.2 /100 | #120 | Exceptional 91.9% |
Demographics Similar to Kiowa by 12th Grade, No Diploma
In terms of 12th grade, no diploma, the demographic groups most similar to Kiowa are Immigrants from Middle Africa (90.0%, a difference of 0.010%), Subsaharan African (90.1%, a difference of 0.020%), Immigrants from Costa Rica (90.0%, a difference of 0.030%), Inupiat (90.1%, a difference of 0.040%), and Crow (90.0%, a difference of 0.040%).
| Demographics | Rating | Rank | 12th Grade, No Diploma |
| Immigrants | Thailand | 2.3 /100 | #233 | Tragic 90.1% |
| Immigrants | South America | 2.3 /100 | #234 | Tragic 90.1% |
| Colville | 2.3 /100 | #235 | Tragic 90.1% |
| Immigrants | Uzbekistan | 2.2 /100 | #236 | Tragic 90.1% |
| Immigrants | Colombia | 2.1 /100 | #237 | Tragic 90.1% |
| Inupiat | 2.0 /100 | #238 | Tragic 90.1% |
| Sub-Saharan Africans | 1.9 /100 | #239 | Tragic 90.1% |
| Kiowa | 1.7 /100 | #240 | Tragic 90.0% |
| Immigrants | Middle Africa | 1.7 /100 | #241 | Tragic 90.0% |
| Immigrants | Costa Rica | 1.6 /100 | #242 | Tragic 90.0% |
| Crow | 1.5 /100 | #243 | Tragic 90.0% |
| Taiwanese | 1.5 /100 | #244 | Tragic 90.0% |
| Immigrants | Uruguay | 1.4 /100 | #245 | Tragic 90.0% |
| Ghanaians | 1.3 /100 | #246 | Tragic 90.0% |
| Immigrants | Nigeria | 1.3 /100 | #247 | Tragic 89.9% |