Immigrants from Zimbabwe vs Houma In Labor Force | Age > 16
COMPARE
Immigrants from Zimbabwe
Houma
In Labor Force | Age > 16
In Labor Force | Age > 16 Comparison
Immigrants from Zimbabwe
Houma
66.8%
IN LABOR FORCE | AGE > 16
100.0/ 100
METRIC RATING
41st/ 347
METRIC RANK
59.5%
IN LABOR FORCE | AGE > 16
0.0/ 100
METRIC RATING
339th/ 347
METRIC RANK
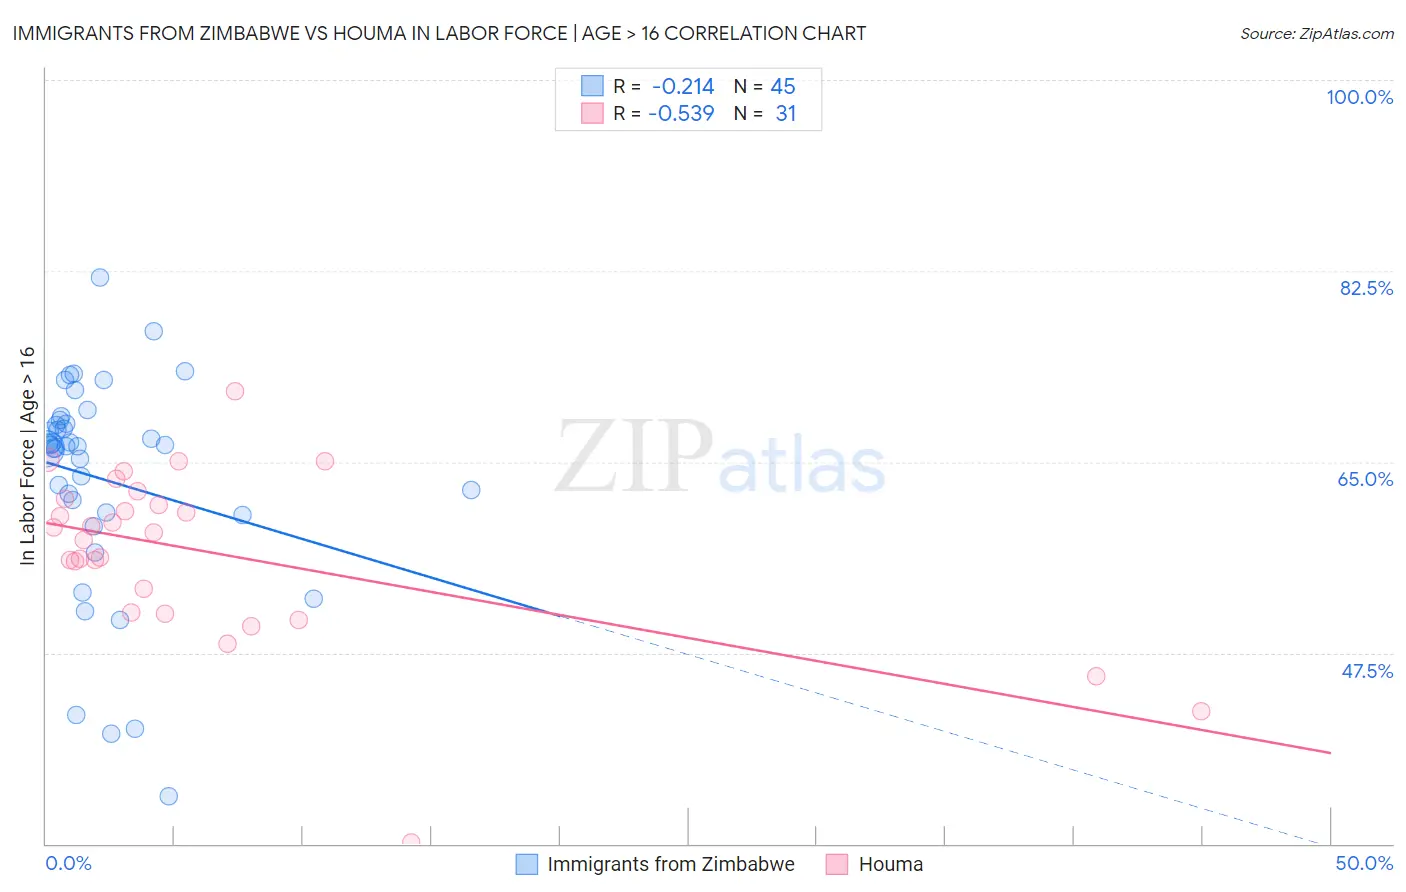
Immigrants from Zimbabwe vs Houma In Labor Force | Age > 16 Correlation Chart
The statistical analysis conducted on geographies consisting of 117,813,757 people shows a weak negative correlation between the proportion of Immigrants from Zimbabwe and labor force participation rate among population ages 16 and over in the United States with a correlation coefficient (R) of -0.214 and weighted average of 66.8%. Similarly, the statistical analysis conducted on geographies consisting of 36,799,095 people shows a substantial negative correlation between the proportion of Houma and labor force participation rate among population ages 16 and over in the United States with a correlation coefficient (R) of -0.539 and weighted average of 59.5%, a difference of 12.3%.
In Labor Force | Age > 16 Correlation Summary
| Measurement | Immigrants from Zimbabwe | Houma |
| Minimum | 34.4% | 30.1% |
| Maximum | 81.9% | 71.5% |
| Range | 47.5% | 41.4% |
| Mean | 63.4% | 56.7% |
| Median | 66.5% | 58.5% |
| Interquartile 25% (IQ1) | 60.2% | 51.2% |
| Interquartile 75% (IQ3) | 68.7% | 61.6% |
| Interquartile Range (IQR) | 8.5% | 10.4% |
| Standard Deviation (Sample) | 10.0% | 8.1% |
| Standard Deviation (Population) | 9.9% | 7.9% |
Similar Demographics by In Labor Force | Age > 16
Demographics Similar to Immigrants from Zimbabwe by In Labor Force | Age > 16
In terms of in labor force | age > 16, the demographic groups most similar to Immigrants from Zimbabwe are Immigrants from El Salvador (66.8%, a difference of 0.0%), Salvadoran (66.8%, a difference of 0.020%), Senegalese (66.7%, a difference of 0.10%), Luxembourger (66.7%, a difference of 0.12%), and Immigrants from Nigeria (66.9%, a difference of 0.17%).
| Demographics | Rating | Rank | In Labor Force | Age > 16 |
| Immigrants | Ghana | 100.0 /100 | #34 | Exceptional 67.1% |
| Immigrants | South Central Asia | 100.0 /100 | #35 | Exceptional 67.1% |
| Immigrants | Western Africa | 100.0 /100 | #36 | Exceptional 67.1% |
| Immigrants | Afghanistan | 100.0 /100 | #37 | Exceptional 67.0% |
| Immigrants | Nigeria | 100.0 /100 | #38 | Exceptional 66.9% |
| Salvadorans | 100.0 /100 | #39 | Exceptional 66.8% |
| Immigrants | El Salvador | 100.0 /100 | #40 | Exceptional 66.8% |
| Immigrants | Zimbabwe | 100.0 /100 | #41 | Exceptional 66.8% |
| Senegalese | 100.0 /100 | #42 | Exceptional 66.7% |
| Luxembourgers | 100.0 /100 | #43 | Exceptional 66.7% |
| Immigrants | Pakistan | 100.0 /100 | #44 | Exceptional 66.7% |
| Immigrants | Brazil | 100.0 /100 | #45 | Exceptional 66.7% |
| Brazilians | 100.0 /100 | #46 | Exceptional 66.6% |
| Immigrants | Bulgaria | 100.0 /100 | #47 | Exceptional 66.6% |
| Nigerians | 100.0 /100 | #48 | Exceptional 66.6% |
Demographics Similar to Houma by In Labor Force | Age > 16
In terms of in labor force | age > 16, the demographic groups most similar to Houma are Immigrants from Yemen (59.6%, a difference of 0.25%), Pueblo (59.3%, a difference of 0.39%), Colville (59.8%, a difference of 0.52%), Menominee (60.6%, a difference of 1.8%), and Native/Alaskan (60.6%, a difference of 1.8%).
| Demographics | Rating | Rank | In Labor Force | Age > 16 |
| Crow | 0.0 /100 | #332 | Tragic 60.8% |
| Paiute | 0.0 /100 | #333 | Tragic 60.7% |
| Apache | 0.0 /100 | #334 | Tragic 60.7% |
| Natives/Alaskans | 0.0 /100 | #335 | Tragic 60.6% |
| Menominee | 0.0 /100 | #336 | Tragic 60.6% |
| Colville | 0.0 /100 | #337 | Tragic 59.8% |
| Immigrants | Yemen | 0.0 /100 | #338 | Tragic 59.6% |
| Houma | 0.0 /100 | #339 | Tragic 59.5% |
| Pueblo | 0.0 /100 | #340 | Tragic 59.3% |
| Hopi | 0.0 /100 | #341 | Tragic 58.4% |
| Puerto Ricans | 0.0 /100 | #342 | Tragic 58.1% |
| Yuman | 0.0 /100 | #343 | Tragic 57.8% |
| Pima | 0.0 /100 | #344 | Tragic 57.4% |
| Tohono O'odham | 0.0 /100 | #345 | Tragic 57.2% |
| Lumbee | 0.0 /100 | #346 | Tragic 56.8% |