Immigrants from Zimbabwe vs Kiowa Family Poverty
COMPARE
Immigrants from Zimbabwe
Kiowa
Family Poverty
Family Poverty Comparison
Immigrants from Zimbabwe
Kiowa
8.2%
FAMILY POVERTY
94.0/ 100
METRIC RATING
114th/ 347
METRIC RANK
12.2%
FAMILY POVERTY
0.0/ 100
METRIC RATING
314th/ 347
METRIC RANK
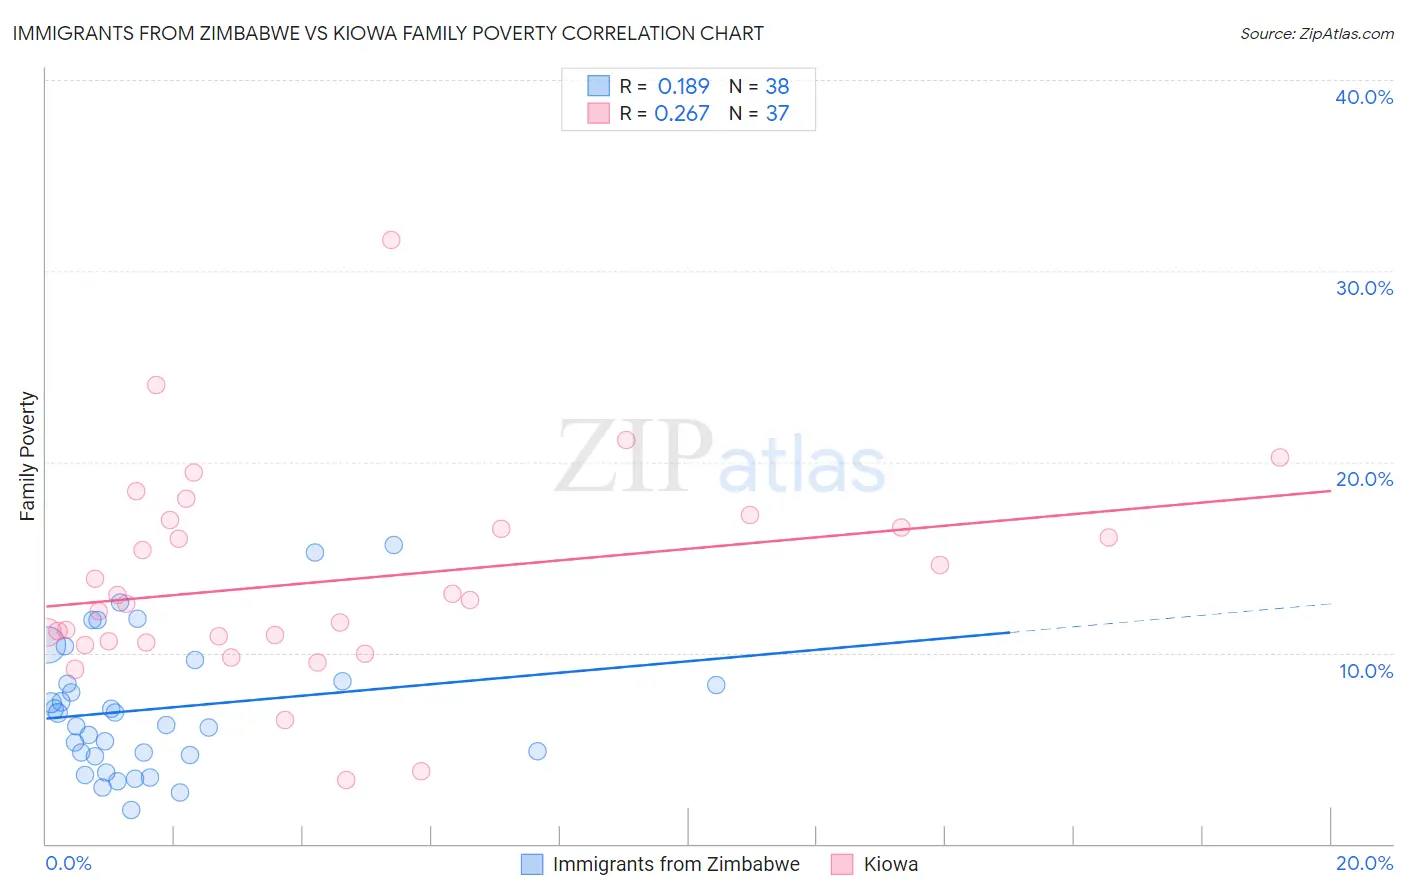
Immigrants from Zimbabwe vs Kiowa Family Poverty Correlation Chart
The statistical analysis conducted on geographies consisting of 117,739,253 people shows a poor positive correlation between the proportion of Immigrants from Zimbabwe and poverty level among families in the United States with a correlation coefficient (R) of 0.189 and weighted average of 8.2%. Similarly, the statistical analysis conducted on geographies consisting of 56,081,442 people shows a weak positive correlation between the proportion of Kiowa and poverty level among families in the United States with a correlation coefficient (R) of 0.267 and weighted average of 12.2%, a difference of 49.4%.
Family Poverty Correlation Summary
| Measurement | Immigrants from Zimbabwe | Kiowa |
| Minimum | 1.8% | 3.4% |
| Maximum | 15.6% | 31.6% |
| Range | 13.8% | 28.3% |
| Mean | 7.1% | 13.8% |
| Median | 6.5% | 12.8% |
| Interquartile 25% (IQ1) | 4.7% | 10.6% |
| Interquartile 75% (IQ3) | 8.5% | 16.8% |
| Interquartile Range (IQR) | 3.8% | 6.2% |
| Standard Deviation (Sample) | 3.4% | 5.4% |
| Standard Deviation (Population) | 3.4% | 5.3% |
Similar Demographics by Family Poverty
Demographics Similar to Immigrants from Zimbabwe by Family Poverty
In terms of family poverty, the demographic groups most similar to Immigrants from Zimbabwe are Canadian (8.2%, a difference of 0.090%), Immigrants from France (8.2%, a difference of 0.26%), Immigrants from Israel (8.2%, a difference of 0.34%), Taiwanese (8.2%, a difference of 0.37%), and South African (8.2%, a difference of 0.41%).
| Demographics | Rating | Rank | Family Poverty |
| French Canadians | 95.0 /100 | #107 | Exceptional 8.1% |
| Basques | 94.9 /100 | #108 | Exceptional 8.1% |
| Jordanians | 94.8 /100 | #109 | Exceptional 8.2% |
| Romanians | 94.7 /100 | #110 | Exceptional 8.2% |
| Taiwanese | 94.6 /100 | #111 | Exceptional 8.2% |
| Immigrants | France | 94.4 /100 | #112 | Exceptional 8.2% |
| Canadians | 94.2 /100 | #113 | Exceptional 8.2% |
| Immigrants | Zimbabwe | 94.0 /100 | #114 | Exceptional 8.2% |
| Immigrants | Israel | 93.5 /100 | #115 | Exceptional 8.2% |
| South Africans | 93.4 /100 | #116 | Exceptional 8.2% |
| Immigrants | Russia | 93.2 /100 | #117 | Exceptional 8.2% |
| Immigrants | Western Europe | 92.9 /100 | #118 | Exceptional 8.2% |
| French | 92.8 /100 | #119 | Exceptional 8.3% |
| Immigrants | Egypt | 91.6 /100 | #120 | Exceptional 8.3% |
| Native Hawaiians | 91.3 /100 | #121 | Exceptional 8.3% |
Demographics Similar to Kiowa by Family Poverty
In terms of family poverty, the demographic groups most similar to Kiowa are Immigrants from Mexico (12.3%, a difference of 0.26%), Immigrants from Caribbean (12.2%, a difference of 0.50%), Honduran (12.4%, a difference of 1.0%), Immigrants from Central America (12.1%, a difference of 1.2%), and Immigrants from Grenada (12.4%, a difference of 1.2%).
| Demographics | Rating | Rank | Family Poverty |
| Immigrants | Congo | 0.0 /100 | #307 | Tragic 11.9% |
| Seminole | 0.0 /100 | #308 | Tragic 11.9% |
| Hispanics or Latinos | 0.0 /100 | #309 | Tragic 12.0% |
| Immigrants | Guatemala | 0.0 /100 | #310 | Tragic 12.0% |
| Ute | 0.0 /100 | #311 | Tragic 12.1% |
| Immigrants | Central America | 0.0 /100 | #312 | Tragic 12.1% |
| Immigrants | Caribbean | 0.0 /100 | #313 | Tragic 12.2% |
| Kiowa | 0.0 /100 | #314 | Tragic 12.2% |
| Immigrants | Mexico | 0.0 /100 | #315 | Tragic 12.3% |
| Hondurans | 0.0 /100 | #316 | Tragic 12.4% |
| Immigrants | Grenada | 0.0 /100 | #317 | Tragic 12.4% |
| U.S. Virgin Islanders | 0.0 /100 | #318 | Tragic 12.4% |
| British West Indians | 0.0 /100 | #319 | Tragic 12.4% |
| Inupiat | 0.0 /100 | #320 | Tragic 12.5% |
| Arapaho | 0.0 /100 | #321 | Tragic 12.7% |