Chilean vs Kiowa In Labor Force | Age > 16
COMPARE
Chilean
Kiowa
In Labor Force | Age > 16
In Labor Force | Age > 16 Comparison
Chileans
Kiowa
66.0%
IN LABOR FORCE | AGE > 16
99.2/ 100
METRIC RATING
90th/ 347
METRIC RANK
62.4%
IN LABOR FORCE | AGE > 16
0.0/ 100
METRIC RATING
317th/ 347
METRIC RANK
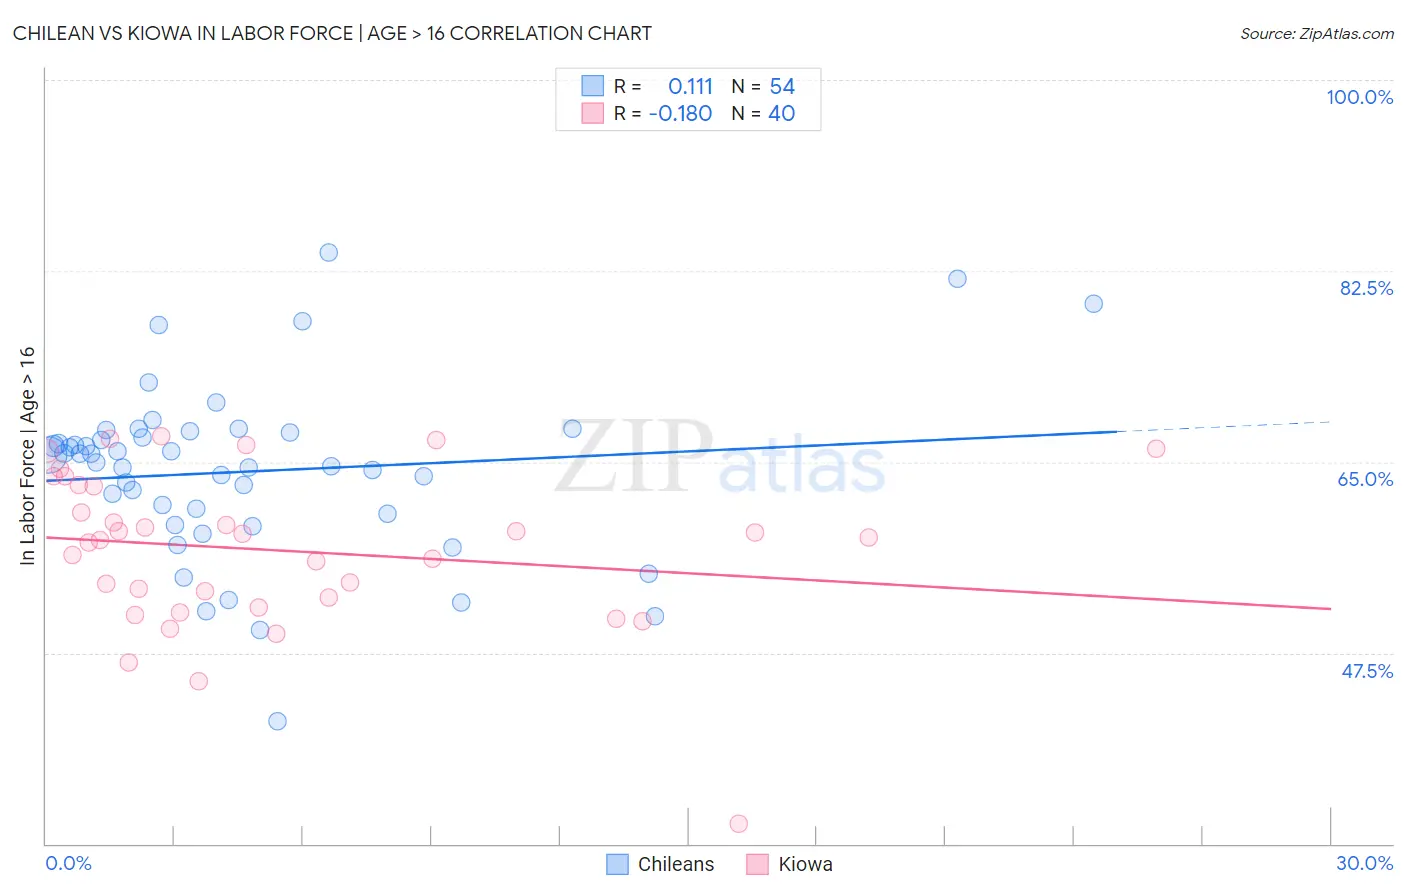
Chilean vs Kiowa In Labor Force | Age > 16 Correlation Chart
The statistical analysis conducted on geographies consisting of 256,687,102 people shows a poor positive correlation between the proportion of Chileans and labor force participation rate among population ages 16 and over in the United States with a correlation coefficient (R) of 0.111 and weighted average of 66.0%. Similarly, the statistical analysis conducted on geographies consisting of 56,099,156 people shows a poor negative correlation between the proportion of Kiowa and labor force participation rate among population ages 16 and over in the United States with a correlation coefficient (R) of -0.180 and weighted average of 62.4%, a difference of 5.8%.
In Labor Force | Age > 16 Correlation Summary
| Measurement | Chilean | Kiowa |
| Minimum | 41.3% | 31.8% |
| Maximum | 84.2% | 67.3% |
| Range | 42.9% | 35.5% |
| Mean | 64.1% | 56.9% |
| Median | 65.3% | 58.0% |
| Interquartile 25% (IQ1) | 60.3% | 52.1% |
| Interquartile 75% (IQ3) | 67.7% | 62.8% |
| Interquartile Range (IQR) | 7.4% | 10.7% |
| Standard Deviation (Sample) | 8.0% | 7.3% |
| Standard Deviation (Population) | 7.9% | 7.2% |
Similar Demographics by In Labor Force | Age > 16
Demographics Similar to Chileans by In Labor Force | Age > 16
In terms of in labor force | age > 16, the demographic groups most similar to Chileans are Immigrants from Laos (66.0%, a difference of 0.0%), Iranian (66.0%, a difference of 0.010%), Aleut (66.0%, a difference of 0.030%), Immigrants from South America (66.0%, a difference of 0.030%), and South American Indian (66.0%, a difference of 0.050%).
| Demographics | Rating | Rank | In Labor Force | Age > 16 |
| Immigrants | Jordan | 99.4 /100 | #83 | Exceptional 66.1% |
| Central Americans | 99.4 /100 | #84 | Exceptional 66.1% |
| Mongolians | 99.4 /100 | #85 | Exceptional 66.1% |
| South Americans | 99.4 /100 | #86 | Exceptional 66.0% |
| South American Indians | 99.4 /100 | #87 | Exceptional 66.0% |
| Bermudans | 99.3 /100 | #88 | Exceptional 66.0% |
| Immigrants | Laos | 99.2 /100 | #89 | Exceptional 66.0% |
| Chileans | 99.2 /100 | #90 | Exceptional 66.0% |
| Iranians | 99.2 /100 | #91 | Exceptional 66.0% |
| Aleuts | 99.1 /100 | #92 | Exceptional 66.0% |
| Immigrants | South America | 99.1 /100 | #93 | Exceptional 66.0% |
| Immigrants | Cambodia | 99.1 /100 | #94 | Exceptional 66.0% |
| Immigrants | Uruguay | 99.1 /100 | #95 | Exceptional 66.0% |
| Bangladeshis | 98.9 /100 | #96 | Exceptional 65.9% |
| Filipinos | 98.9 /100 | #97 | Exceptional 65.9% |
Demographics Similar to Kiowa by In Labor Force | Age > 16
In terms of in labor force | age > 16, the demographic groups most similar to Kiowa are Chickasaw (62.3%, a difference of 0.19%), Arapaho (62.1%, a difference of 0.44%), Yakama (62.1%, a difference of 0.44%), Yup'ik (62.7%, a difference of 0.45%), and American (62.1%, a difference of 0.47%).
| Demographics | Rating | Rank | In Labor Force | Age > 16 |
| Shoshone | 0.0 /100 | #310 | Tragic 63.2% |
| Blackfeet | 0.0 /100 | #311 | Tragic 63.2% |
| Iroquois | 0.0 /100 | #312 | Tragic 63.2% |
| Chippewa | 0.0 /100 | #313 | Tragic 63.1% |
| Yaqui | 0.0 /100 | #314 | Tragic 63.0% |
| Potawatomi | 0.0 /100 | #315 | Tragic 62.8% |
| Yup'ik | 0.0 /100 | #316 | Tragic 62.7% |
| Kiowa | 0.0 /100 | #317 | Tragic 62.4% |
| Chickasaw | 0.0 /100 | #318 | Tragic 62.3% |
| Arapaho | 0.0 /100 | #319 | Tragic 62.1% |
| Yakama | 0.0 /100 | #320 | Tragic 62.1% |
| Americans | 0.0 /100 | #321 | Tragic 62.1% |
| Ottawa | 0.0 /100 | #322 | Tragic 62.0% |
| Seminole | 0.0 /100 | #323 | Tragic 62.0% |
| Cheyenne | 0.0 /100 | #324 | Tragic 62.0% |