Immigrants from Zimbabwe vs Kiowa Median Earnings
COMPARE
Immigrants from Zimbabwe
Kiowa
Median Earnings
Median Earnings Comparison
Immigrants from Zimbabwe
Kiowa
$48,913
MEDIAN EARNINGS
97.0/ 100
METRIC RATING
111th/ 347
METRIC RANK
$39,232
MEDIAN EARNINGS
0.0/ 100
METRIC RATING
329th/ 347
METRIC RANK
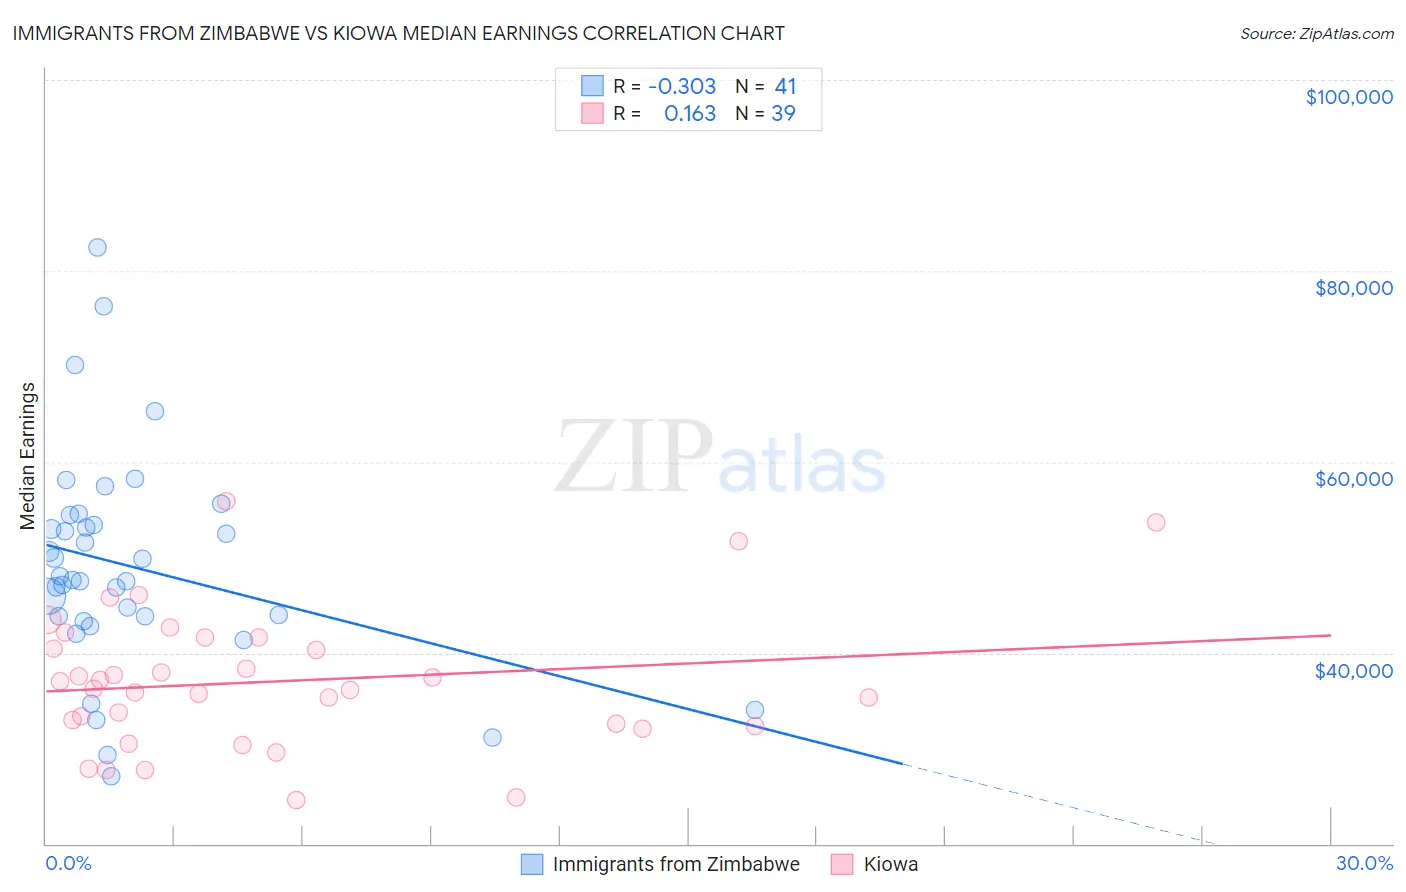
Immigrants from Zimbabwe vs Kiowa Median Earnings Correlation Chart
The statistical analysis conducted on geographies consisting of 117,811,113 people shows a mild negative correlation between the proportion of Immigrants from Zimbabwe and median earnings in the United States with a correlation coefficient (R) of -0.303 and weighted average of $48,913. Similarly, the statistical analysis conducted on geographies consisting of 56,100,586 people shows a poor positive correlation between the proportion of Kiowa and median earnings in the United States with a correlation coefficient (R) of 0.163 and weighted average of $39,232, a difference of 24.7%.
Median Earnings Correlation Summary
| Measurement | Immigrants from Zimbabwe | Kiowa |
| Minimum | $27,083 | $24,615 |
| Maximum | $82,500 | $55,938 |
| Range | $55,417 | $31,323 |
| Mean | $49,057 | $37,003 |
| Median | $47,680 | $36,193 |
| Interquartile 25% (IQ1) | $43,542 | $32,335 |
| Interquartile 75% (IQ3) | $53,907 | $41,599 |
| Interquartile Range (IQR) | $10,364 | $9,264 |
| Standard Deviation (Sample) | $11,395 | $7,253 |
| Standard Deviation (Population) | $11,255 | $7,159 |
Similar Demographics by Median Earnings
Demographics Similar to Immigrants from Zimbabwe by Median Earnings
In terms of median earnings, the demographic groups most similar to Immigrants from Zimbabwe are Immigrants from Ethiopia ($48,924, a difference of 0.020%), Syrian ($48,934, a difference of 0.040%), Northern European ($48,887, a difference of 0.050%), Immigrants from Kuwait ($48,861, a difference of 0.11%), and Moroccan ($48,838, a difference of 0.15%).
| Demographics | Rating | Rank | Median Earnings |
| Immigrants | Brazil | 98.6 /100 | #104 | Exceptional $49,463 |
| Immigrants | Western Asia | 98.4 /100 | #105 | Exceptional $49,389 |
| Immigrants | Albania | 98.4 /100 | #106 | Exceptional $49,377 |
| Immigrants | Morocco | 98.4 /100 | #107 | Exceptional $49,368 |
| Palestinians | 98.0 /100 | #108 | Exceptional $49,209 |
| Syrians | 97.1 /100 | #109 | Exceptional $48,934 |
| Immigrants | Ethiopia | 97.1 /100 | #110 | Exceptional $48,924 |
| Immigrants | Zimbabwe | 97.0 /100 | #111 | Exceptional $48,913 |
| Northern Europeans | 96.9 /100 | #112 | Exceptional $48,887 |
| Immigrants | Kuwait | 96.8 /100 | #113 | Exceptional $48,861 |
| Moroccans | 96.7 /100 | #114 | Exceptional $48,838 |
| Chinese | 96.7 /100 | #115 | Exceptional $48,836 |
| Koreans | 96.2 /100 | #116 | Exceptional $48,727 |
| Serbians | 95.9 /100 | #117 | Exceptional $48,677 |
| Immigrants | Jordan | 95.9 /100 | #118 | Exceptional $48,673 |
Demographics Similar to Kiowa by Median Earnings
In terms of median earnings, the demographic groups most similar to Kiowa are Immigrants from Congo ($39,169, a difference of 0.16%), Immigrants from Mexico ($39,114, a difference of 0.30%), Yakama ($39,107, a difference of 0.32%), Sioux ($39,448, a difference of 0.55%), and Houma ($38,949, a difference of 0.73%).
| Demographics | Rating | Rank | Median Earnings |
| Immigrants | Central America | 0.0 /100 | #322 | Tragic $39,762 |
| Bahamians | 0.0 /100 | #323 | Tragic $39,735 |
| Ottawa | 0.0 /100 | #324 | Tragic $39,721 |
| Creek | 0.0 /100 | #325 | Tragic $39,648 |
| Immigrants | Yemen | 0.0 /100 | #326 | Tragic $39,540 |
| Yuman | 0.0 /100 | #327 | Tragic $39,523 |
| Sioux | 0.0 /100 | #328 | Tragic $39,448 |
| Kiowa | 0.0 /100 | #329 | Tragic $39,232 |
| Immigrants | Congo | 0.0 /100 | #330 | Tragic $39,169 |
| Immigrants | Mexico | 0.0 /100 | #331 | Tragic $39,114 |
| Yakama | 0.0 /100 | #332 | Tragic $39,107 |
| Houma | 0.0 /100 | #333 | Tragic $38,949 |
| Spanish American Indians | 0.0 /100 | #334 | Tragic $38,907 |
| Natives/Alaskans | 0.0 /100 | #335 | Tragic $38,896 |
| Crow | 0.0 /100 | #336 | Tragic $38,707 |