Immigrants from Zimbabwe vs Immigrants from Laos In Labor Force | Age > 16
COMPARE
Immigrants from Zimbabwe
Immigrants from Laos
In Labor Force | Age > 16
In Labor Force | Age > 16 Comparison
Immigrants from Zimbabwe
Immigrants from Laos
66.8%
IN LABOR FORCE | AGE > 16
100.0/ 100
METRIC RATING
41st/ 347
METRIC RANK
66.0%
IN LABOR FORCE | AGE > 16
99.2/ 100
METRIC RATING
89th/ 347
METRIC RANK
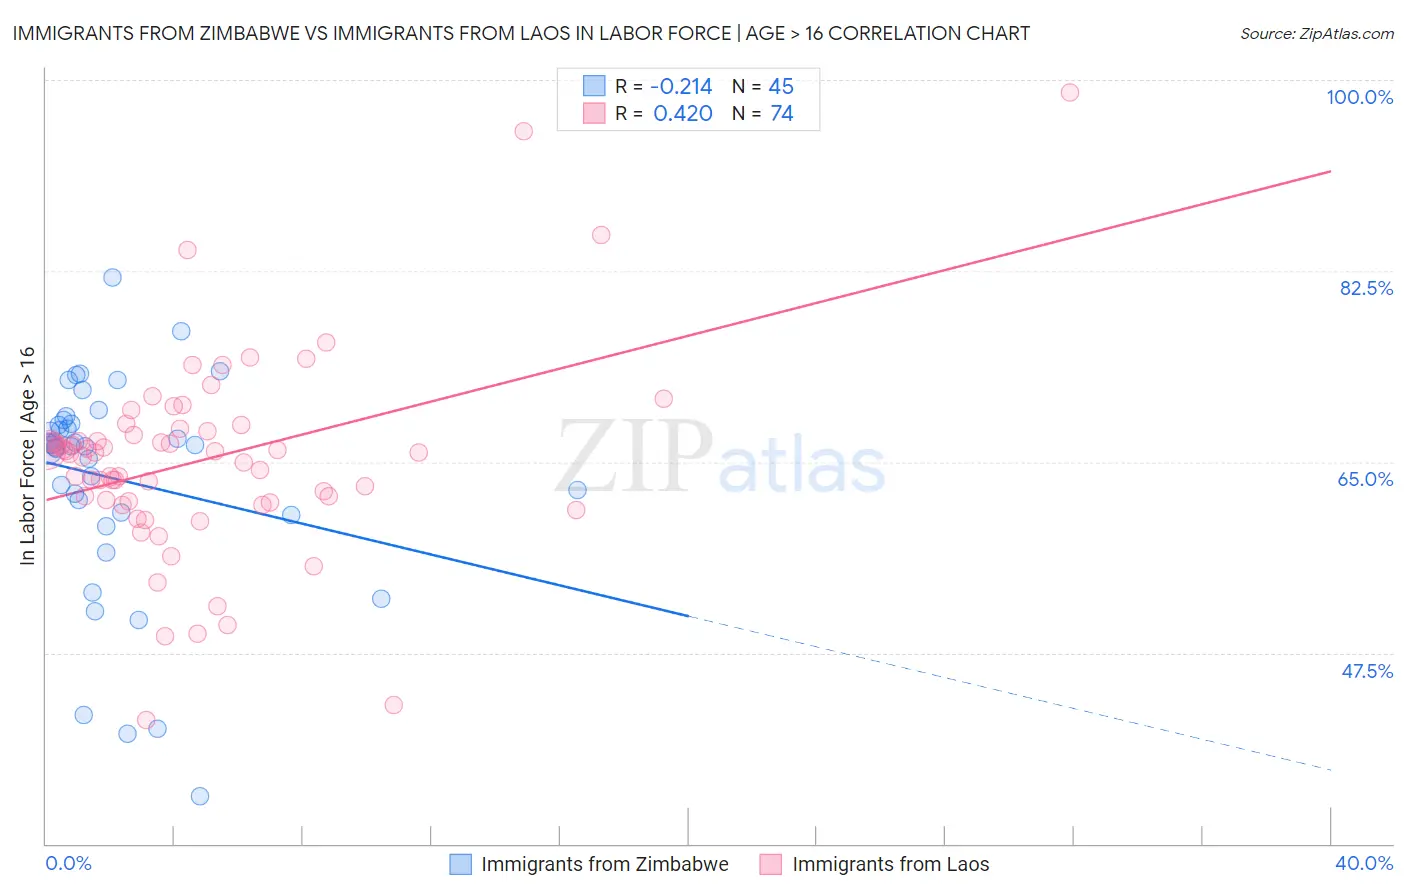
Immigrants from Zimbabwe vs Immigrants from Laos In Labor Force | Age > 16 Correlation Chart
The statistical analysis conducted on geographies consisting of 117,813,757 people shows a weak negative correlation between the proportion of Immigrants from Zimbabwe and labor force participation rate among population ages 16 and over in the United States with a correlation coefficient (R) of -0.214 and weighted average of 66.8%. Similarly, the statistical analysis conducted on geographies consisting of 201,472,286 people shows a moderate positive correlation between the proportion of Immigrants from Laos and labor force participation rate among population ages 16 and over in the United States with a correlation coefficient (R) of 0.420 and weighted average of 66.0%, a difference of 1.2%.
In Labor Force | Age > 16 Correlation Summary
| Measurement | Immigrants from Zimbabwe | Immigrants from Laos |
| Minimum | 34.4% | 41.3% |
| Maximum | 81.9% | 98.9% |
| Range | 47.5% | 57.6% |
| Mean | 63.4% | 65.2% |
| Median | 66.5% | 65.9% |
| Interquartile 25% (IQ1) | 60.2% | 61.4% |
| Interquartile 75% (IQ3) | 68.7% | 67.8% |
| Interquartile Range (IQR) | 8.5% | 6.4% |
| Standard Deviation (Sample) | 10.0% | 9.2% |
| Standard Deviation (Population) | 9.9% | 9.1% |
Similar Demographics by In Labor Force | Age > 16
Demographics Similar to Immigrants from Zimbabwe by In Labor Force | Age > 16
In terms of in labor force | age > 16, the demographic groups most similar to Immigrants from Zimbabwe are Immigrants from El Salvador (66.8%, a difference of 0.0%), Salvadoran (66.8%, a difference of 0.020%), Senegalese (66.7%, a difference of 0.10%), Luxembourger (66.7%, a difference of 0.12%), and Immigrants from Nigeria (66.9%, a difference of 0.17%).
| Demographics | Rating | Rank | In Labor Force | Age > 16 |
| Immigrants | Ghana | 100.0 /100 | #34 | Exceptional 67.1% |
| Immigrants | South Central Asia | 100.0 /100 | #35 | Exceptional 67.1% |
| Immigrants | Western Africa | 100.0 /100 | #36 | Exceptional 67.1% |
| Immigrants | Afghanistan | 100.0 /100 | #37 | Exceptional 67.0% |
| Immigrants | Nigeria | 100.0 /100 | #38 | Exceptional 66.9% |
| Salvadorans | 100.0 /100 | #39 | Exceptional 66.8% |
| Immigrants | El Salvador | 100.0 /100 | #40 | Exceptional 66.8% |
| Immigrants | Zimbabwe | 100.0 /100 | #41 | Exceptional 66.8% |
| Senegalese | 100.0 /100 | #42 | Exceptional 66.7% |
| Luxembourgers | 100.0 /100 | #43 | Exceptional 66.7% |
| Immigrants | Pakistan | 100.0 /100 | #44 | Exceptional 66.7% |
| Immigrants | Brazil | 100.0 /100 | #45 | Exceptional 66.7% |
| Brazilians | 100.0 /100 | #46 | Exceptional 66.6% |
| Immigrants | Bulgaria | 100.0 /100 | #47 | Exceptional 66.6% |
| Nigerians | 100.0 /100 | #48 | Exceptional 66.6% |
Demographics Similar to Immigrants from Laos by In Labor Force | Age > 16
In terms of in labor force | age > 16, the demographic groups most similar to Immigrants from Laos are Chilean (66.0%, a difference of 0.0%), Iranian (66.0%, a difference of 0.010%), Aleut (66.0%, a difference of 0.030%), Immigrants from South America (66.0%, a difference of 0.030%), and South American (66.0%, a difference of 0.050%).
| Demographics | Rating | Rank | In Labor Force | Age > 16 |
| German Russians | 99.4 /100 | #82 | Exceptional 66.1% |
| Immigrants | Jordan | 99.4 /100 | #83 | Exceptional 66.1% |
| Central Americans | 99.4 /100 | #84 | Exceptional 66.1% |
| Mongolians | 99.4 /100 | #85 | Exceptional 66.1% |
| South Americans | 99.4 /100 | #86 | Exceptional 66.0% |
| South American Indians | 99.4 /100 | #87 | Exceptional 66.0% |
| Bermudans | 99.3 /100 | #88 | Exceptional 66.0% |
| Immigrants | Laos | 99.2 /100 | #89 | Exceptional 66.0% |
| Chileans | 99.2 /100 | #90 | Exceptional 66.0% |
| Iranians | 99.2 /100 | #91 | Exceptional 66.0% |
| Aleuts | 99.1 /100 | #92 | Exceptional 66.0% |
| Immigrants | South America | 99.1 /100 | #93 | Exceptional 66.0% |
| Immigrants | Cambodia | 99.1 /100 | #94 | Exceptional 66.0% |
| Immigrants | Uruguay | 99.1 /100 | #95 | Exceptional 66.0% |
| Bangladeshis | 98.9 /100 | #96 | Exceptional 65.9% |