British West Indian vs Kiowa In Labor Force | Age > 16
COMPARE
British West Indian
Kiowa
In Labor Force | Age > 16
In Labor Force | Age > 16 Comparison
British West Indians
Kiowa
64.4%
IN LABOR FORCE | AGE > 16
1.8/ 100
METRIC RATING
250th/ 347
METRIC RANK
62.4%
IN LABOR FORCE | AGE > 16
0.0/ 100
METRIC RATING
317th/ 347
METRIC RANK
British West Indian vs Kiowa In Labor Force | Age > 16 Correlation Chart
The statistical analysis conducted on geographies consisting of 152,701,183 people shows a slight negative correlation between the proportion of British West Indians and labor force participation rate among population ages 16 and over in the United States with a correlation coefficient (R) of -0.084 and weighted average of 64.4%. Similarly, the statistical analysis conducted on geographies consisting of 56,099,156 people shows a poor negative correlation between the proportion of Kiowa and labor force participation rate among population ages 16 and over in the United States with a correlation coefficient (R) of -0.180 and weighted average of 62.4%, a difference of 3.2%.
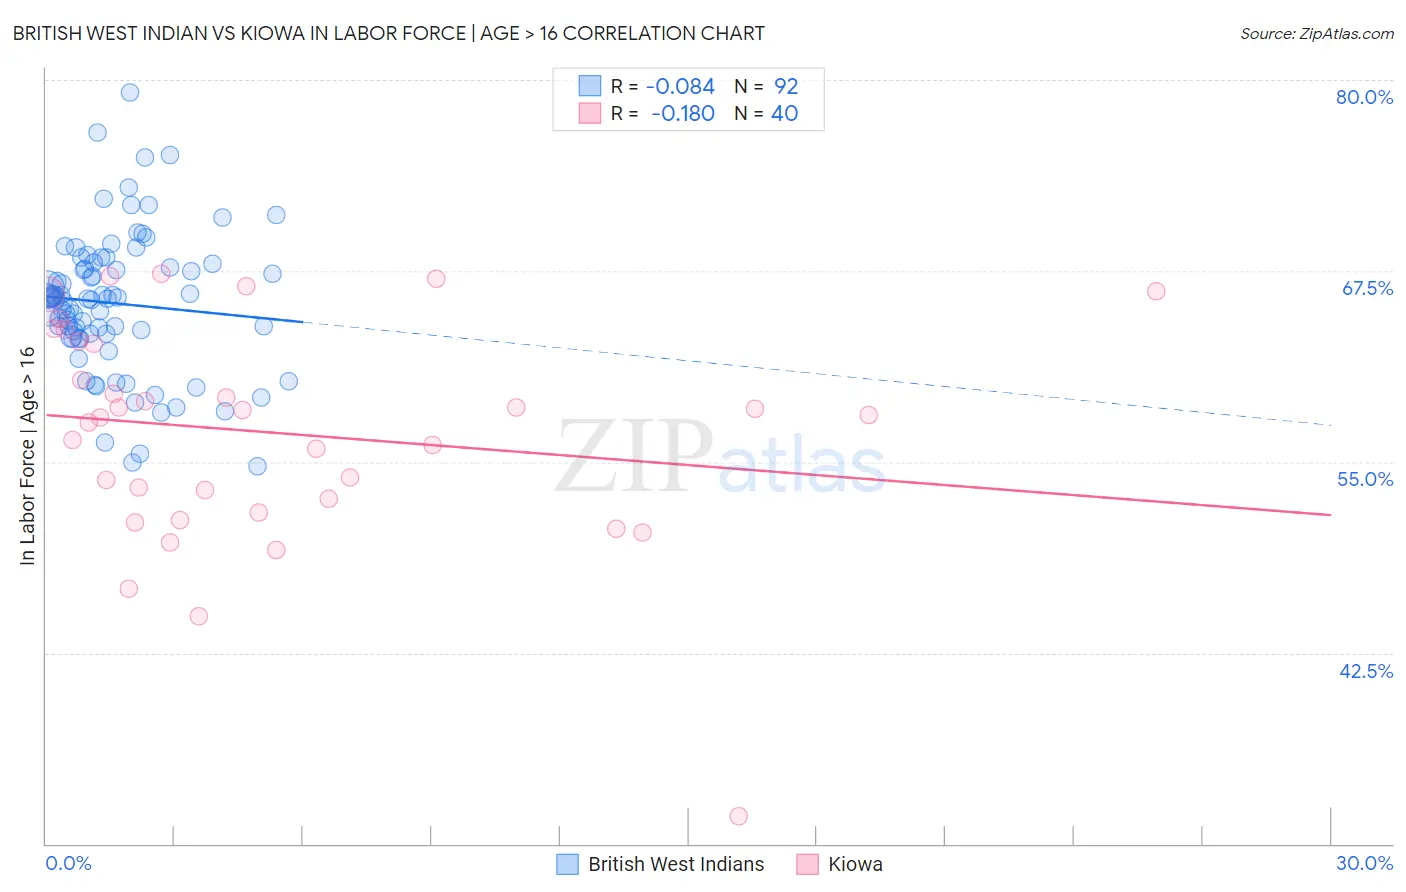
In Labor Force | Age > 16 Correlation Summary
| Measurement | British West Indian | Kiowa |
| Minimum | 54.7% | 31.8% |
| Maximum | 79.2% | 67.3% |
| Range | 24.5% | 35.5% |
| Mean | 65.4% | 56.9% |
| Median | 65.7% | 58.0% |
| Interquartile 25% (IQ1) | 63.3% | 52.1% |
| Interquartile 75% (IQ3) | 67.8% | 62.8% |
| Interquartile Range (IQR) | 4.6% | 10.7% |
| Standard Deviation (Sample) | 4.6% | 7.3% |
| Standard Deviation (Population) | 4.5% | 7.2% |
Similar Demographics by In Labor Force | Age > 16
Demographics Similar to British West Indians by In Labor Force | Age > 16
In terms of in labor force | age > 16, the demographic groups most similar to British West Indians are German (64.4%, a difference of 0.010%), Portuguese (64.4%, a difference of 0.020%), Immigrants from Barbados (64.4%, a difference of 0.040%), Swiss (64.4%, a difference of 0.050%), and Immigrants from Dominican Republic (64.4%, a difference of 0.050%).
| Demographics | Rating | Rank | In Labor Force | Age > 16 |
| Immigrants | Lebanon | 3.2 /100 | #243 | Tragic 64.5% |
| Tsimshian | 3.1 /100 | #244 | Tragic 64.5% |
| West Indians | 3.0 /100 | #245 | Tragic 64.5% |
| Immigrants | Caribbean | 2.3 /100 | #246 | Tragic 64.4% |
| Swiss | 2.1 /100 | #247 | Tragic 64.4% |
| Immigrants | Barbados | 2.1 /100 | #248 | Tragic 64.4% |
| Germans | 1.8 /100 | #249 | Tragic 64.4% |
| British West Indians | 1.8 /100 | #250 | Tragic 64.4% |
| Portuguese | 1.6 /100 | #251 | Tragic 64.4% |
| Immigrants | Dominican Republic | 1.5 /100 | #252 | Tragic 64.4% |
| Czechoslovakians | 1.4 /100 | #253 | Tragic 64.3% |
| Immigrants | Uzbekistan | 1.4 /100 | #254 | Tragic 64.3% |
| Hispanics or Latinos | 1.1 /100 | #255 | Tragic 64.3% |
| Immigrants | Mexico | 1.0 /100 | #256 | Tragic 64.3% |
| Inupiat | 0.8 /100 | #257 | Tragic 64.3% |
Demographics Similar to Kiowa by In Labor Force | Age > 16
In terms of in labor force | age > 16, the demographic groups most similar to Kiowa are Chickasaw (62.3%, a difference of 0.19%), Arapaho (62.1%, a difference of 0.44%), Yakama (62.1%, a difference of 0.44%), Yup'ik (62.7%, a difference of 0.45%), and American (62.1%, a difference of 0.47%).
| Demographics | Rating | Rank | In Labor Force | Age > 16 |
| Shoshone | 0.0 /100 | #310 | Tragic 63.2% |
| Blackfeet | 0.0 /100 | #311 | Tragic 63.2% |
| Iroquois | 0.0 /100 | #312 | Tragic 63.2% |
| Chippewa | 0.0 /100 | #313 | Tragic 63.1% |
| Yaqui | 0.0 /100 | #314 | Tragic 63.0% |
| Potawatomi | 0.0 /100 | #315 | Tragic 62.8% |
| Yup'ik | 0.0 /100 | #316 | Tragic 62.7% |
| Kiowa | 0.0 /100 | #317 | Tragic 62.4% |
| Chickasaw | 0.0 /100 | #318 | Tragic 62.3% |
| Arapaho | 0.0 /100 | #319 | Tragic 62.1% |
| Yakama | 0.0 /100 | #320 | Tragic 62.1% |
| Americans | 0.0 /100 | #321 | Tragic 62.1% |
| Ottawa | 0.0 /100 | #322 | Tragic 62.0% |
| Seminole | 0.0 /100 | #323 | Tragic 62.0% |
| Cheyenne | 0.0 /100 | #324 | Tragic 62.0% |