Peruvian vs Kiowa In Labor Force | Age > 16
COMPARE
Peruvian
Kiowa
In Labor Force | Age > 16
In Labor Force | Age > 16 Comparison
Peruvians
Kiowa
66.3%
IN LABOR FORCE | AGE > 16
99.8/ 100
METRIC RATING
64th/ 347
METRIC RANK
62.4%
IN LABOR FORCE | AGE > 16
0.0/ 100
METRIC RATING
317th/ 347
METRIC RANK
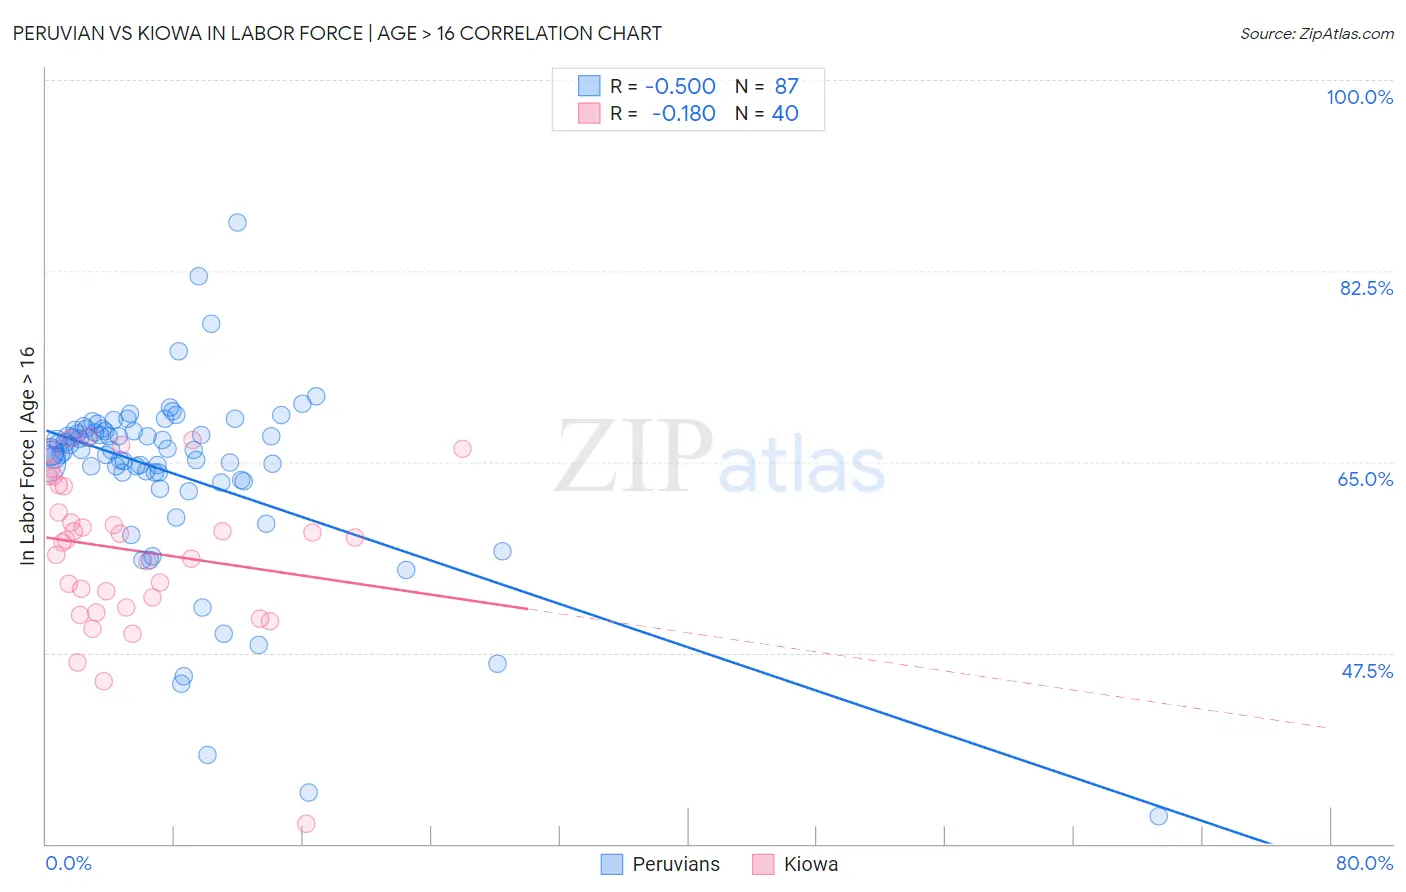
Peruvian vs Kiowa In Labor Force | Age > 16 Correlation Chart
The statistical analysis conducted on geographies consisting of 363,253,331 people shows a moderate negative correlation between the proportion of Peruvians and labor force participation rate among population ages 16 and over in the United States with a correlation coefficient (R) of -0.500 and weighted average of 66.3%. Similarly, the statistical analysis conducted on geographies consisting of 56,099,156 people shows a poor negative correlation between the proportion of Kiowa and labor force participation rate among population ages 16 and over in the United States with a correlation coefficient (R) of -0.180 and weighted average of 62.4%, a difference of 6.2%.
In Labor Force | Age > 16 Correlation Summary
| Measurement | Peruvian | Kiowa |
| Minimum | 32.5% | 31.8% |
| Maximum | 86.9% | 67.3% |
| Range | 54.4% | 35.5% |
| Mean | 64.0% | 56.9% |
| Median | 66.1% | 58.0% |
| Interquartile 25% (IQ1) | 63.4% | 52.1% |
| Interquartile 75% (IQ3) | 67.8% | 62.8% |
| Interquartile Range (IQR) | 4.4% | 10.7% |
| Standard Deviation (Sample) | 8.6% | 7.3% |
| Standard Deviation (Population) | 8.6% | 7.2% |
Similar Demographics by In Labor Force | Age > 16
Demographics Similar to Peruvians by In Labor Force | Age > 16
In terms of in labor force | age > 16, the demographic groups most similar to Peruvians are Venezuelan (66.3%, a difference of 0.0%), Sri Lankan (66.3%, a difference of 0.010%), Jordanian (66.3%, a difference of 0.030%), Immigrants from Peru (66.3%, a difference of 0.040%), and Immigrants from Burma/Myanmar (66.3%, a difference of 0.040%).
| Demographics | Rating | Rank | In Labor Force | Age > 16 |
| Bulgarians | 99.9 /100 | #57 | Exceptional 66.4% |
| Immigrants | Saudi Arabia | 99.9 /100 | #58 | Exceptional 66.3% |
| Immigrants | Turkey | 99.9 /100 | #59 | Exceptional 66.3% |
| Immigrants | Peru | 99.8 /100 | #60 | Exceptional 66.3% |
| Immigrants | Burma/Myanmar | 99.8 /100 | #61 | Exceptional 66.3% |
| Indonesians | 99.8 /100 | #62 | Exceptional 66.3% |
| Venezuelans | 99.8 /100 | #63 | Exceptional 66.3% |
| Peruvians | 99.8 /100 | #64 | Exceptional 66.3% |
| Sri Lankans | 99.8 /100 | #65 | Exceptional 66.3% |
| Jordanians | 99.8 /100 | #66 | Exceptional 66.3% |
| Egyptians | 99.8 /100 | #67 | Exceptional 66.2% |
| Immigrants | Egypt | 99.7 /100 | #68 | Exceptional 66.2% |
| Sub-Saharan Africans | 99.7 /100 | #69 | Exceptional 66.2% |
| Asians | 99.7 /100 | #70 | Exceptional 66.2% |
| Burmese | 99.7 /100 | #71 | Exceptional 66.2% |
Demographics Similar to Kiowa by In Labor Force | Age > 16
In terms of in labor force | age > 16, the demographic groups most similar to Kiowa are Chickasaw (62.3%, a difference of 0.19%), Arapaho (62.1%, a difference of 0.44%), Yakama (62.1%, a difference of 0.44%), Yup'ik (62.7%, a difference of 0.45%), and American (62.1%, a difference of 0.47%).
| Demographics | Rating | Rank | In Labor Force | Age > 16 |
| Shoshone | 0.0 /100 | #310 | Tragic 63.2% |
| Blackfeet | 0.0 /100 | #311 | Tragic 63.2% |
| Iroquois | 0.0 /100 | #312 | Tragic 63.2% |
| Chippewa | 0.0 /100 | #313 | Tragic 63.1% |
| Yaqui | 0.0 /100 | #314 | Tragic 63.0% |
| Potawatomi | 0.0 /100 | #315 | Tragic 62.8% |
| Yup'ik | 0.0 /100 | #316 | Tragic 62.7% |
| Kiowa | 0.0 /100 | #317 | Tragic 62.4% |
| Chickasaw | 0.0 /100 | #318 | Tragic 62.3% |
| Arapaho | 0.0 /100 | #319 | Tragic 62.1% |
| Yakama | 0.0 /100 | #320 | Tragic 62.1% |
| Americans | 0.0 /100 | #321 | Tragic 62.1% |
| Ottawa | 0.0 /100 | #322 | Tragic 62.0% |
| Seminole | 0.0 /100 | #323 | Tragic 62.0% |
| Cheyenne | 0.0 /100 | #324 | Tragic 62.0% |