Immigrants from Uganda vs Immigrants from Dominican Republic In Labor Force | Age > 16
COMPARE
Immigrants from Uganda
Immigrants from Dominican Republic
In Labor Force | Age > 16
In Labor Force | Age > 16 Comparison
Immigrants from Uganda
Immigrants from Dominican Republic
67.5%
IN LABOR FORCE | AGE > 16
100.0/ 100
METRIC RATING
22nd/ 347
METRIC RANK
64.4%
IN LABOR FORCE | AGE > 16
1.5/ 100
METRIC RATING
252nd/ 347
METRIC RANK
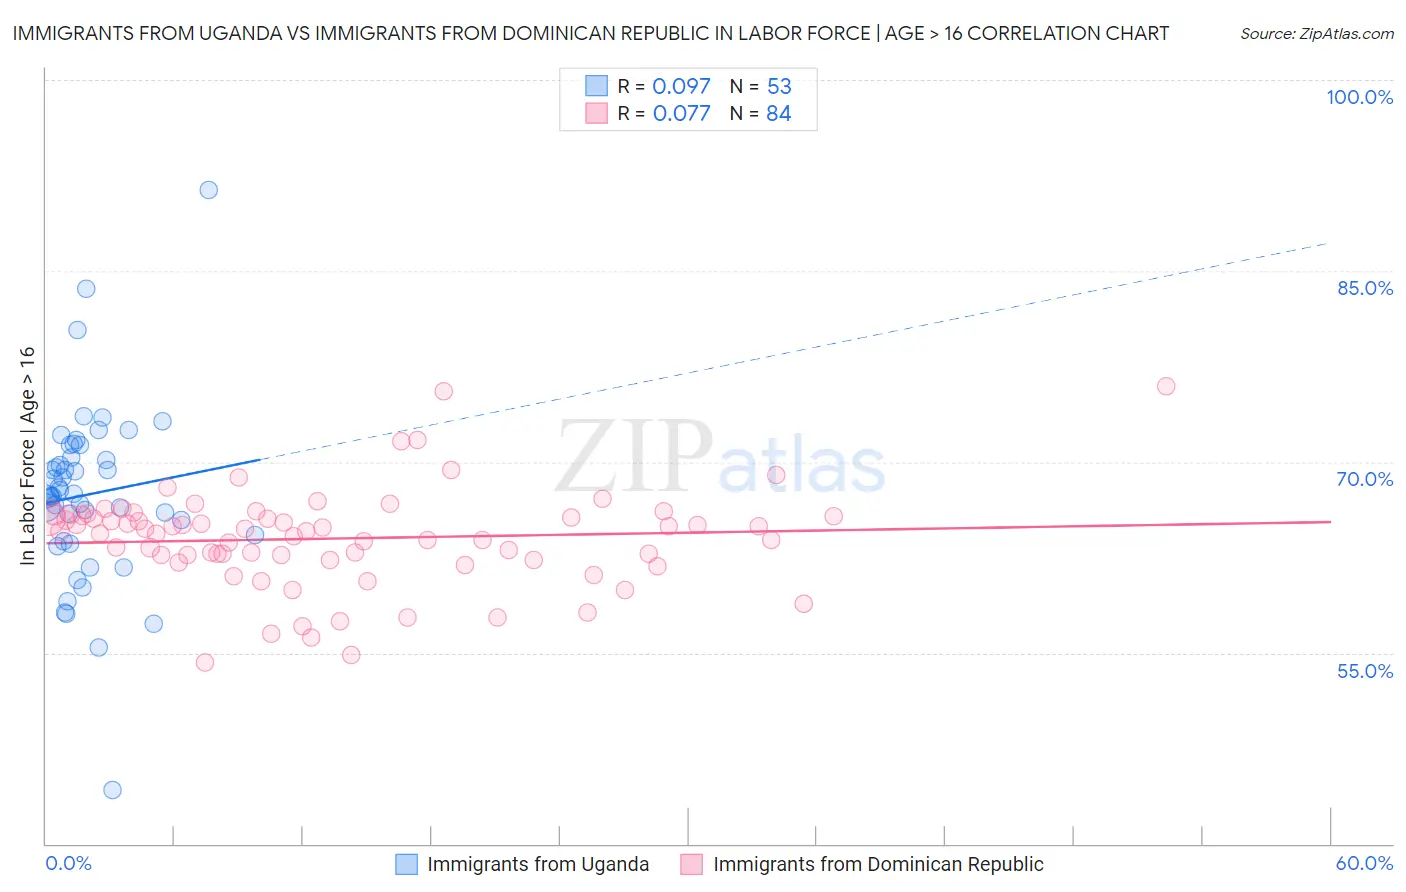
Immigrants from Uganda vs Immigrants from Dominican Republic In Labor Force | Age > 16 Correlation Chart
The statistical analysis conducted on geographies consisting of 125,982,197 people shows a slight positive correlation between the proportion of Immigrants from Uganda and labor force participation rate among population ages 16 and over in the United States with a correlation coefficient (R) of 0.097 and weighted average of 67.5%. Similarly, the statistical analysis conducted on geographies consisting of 275,136,477 people shows a slight positive correlation between the proportion of Immigrants from Dominican Republic and labor force participation rate among population ages 16 and over in the United States with a correlation coefficient (R) of 0.077 and weighted average of 64.4%, a difference of 4.9%.
In Labor Force | Age > 16 Correlation Summary
| Measurement | Immigrants from Uganda | Immigrants from Dominican Republic |
| Minimum | 44.2% | 54.3% |
| Maximum | 91.4% | 75.9% |
| Range | 47.2% | 21.6% |
| Mean | 67.4% | 64.0% |
| Median | 67.4% | 64.6% |
| Interquartile 25% (IQ1) | 64.0% | 62.5% |
| Interquartile 75% (IQ3) | 70.8% | 65.7% |
| Interquartile Range (IQR) | 6.8% | 3.3% |
| Standard Deviation (Sample) | 7.0% | 3.8% |
| Standard Deviation (Population) | 6.9% | 3.8% |
Similar Demographics by In Labor Force | Age > 16
Demographics Similar to Immigrants from Uganda by In Labor Force | Age > 16
In terms of in labor force | age > 16, the demographic groups most similar to Immigrants from Uganda are Tongan (67.5%, a difference of 0.060%), Immigrants from Kenya (67.6%, a difference of 0.080%), Cambodian (67.4%, a difference of 0.12%), Kenyan (67.6%, a difference of 0.13%), and Immigrants from Liberia (67.6%, a difference of 0.16%).
| Demographics | Rating | Rank | In Labor Force | Age > 16 |
| Immigrants | Middle Africa | 100.0 /100 | #15 | Exceptional 67.7% |
| Immigrants | Sudan | 100.0 /100 | #16 | Exceptional 67.7% |
| Immigrants | India | 100.0 /100 | #17 | Exceptional 67.6% |
| Immigrants | Liberia | 100.0 /100 | #18 | Exceptional 67.6% |
| Kenyans | 100.0 /100 | #19 | Exceptional 67.6% |
| Immigrants | Kenya | 100.0 /100 | #20 | Exceptional 67.6% |
| Tongans | 100.0 /100 | #21 | Exceptional 67.5% |
| Immigrants | Uganda | 100.0 /100 | #22 | Exceptional 67.5% |
| Cambodians | 100.0 /100 | #23 | Exceptional 67.4% |
| Ugandans | 100.0 /100 | #24 | Exceptional 67.4% |
| Immigrants | Africa | 100.0 /100 | #25 | Exceptional 67.4% |
| Immigrants | Cabo Verde | 100.0 /100 | #26 | Exceptional 67.3% |
| Zimbabweans | 100.0 /100 | #27 | Exceptional 67.3% |
| Immigrants | Morocco | 100.0 /100 | #28 | Exceptional 67.2% |
| Thais | 100.0 /100 | #29 | Exceptional 67.2% |
Demographics Similar to Immigrants from Dominican Republic by In Labor Force | Age > 16
In terms of in labor force | age > 16, the demographic groups most similar to Immigrants from Dominican Republic are Czechoslovakian (64.3%, a difference of 0.010%), Immigrants from Uzbekistan (64.3%, a difference of 0.010%), Portuguese (64.4%, a difference of 0.030%), British West Indian (64.4%, a difference of 0.050%), and German (64.4%, a difference of 0.060%).
| Demographics | Rating | Rank | In Labor Force | Age > 16 |
| West Indians | 3.0 /100 | #245 | Tragic 64.5% |
| Immigrants | Caribbean | 2.3 /100 | #246 | Tragic 64.4% |
| Swiss | 2.1 /100 | #247 | Tragic 64.4% |
| Immigrants | Barbados | 2.1 /100 | #248 | Tragic 64.4% |
| Germans | 1.8 /100 | #249 | Tragic 64.4% |
| British West Indians | 1.8 /100 | #250 | Tragic 64.4% |
| Portuguese | 1.6 /100 | #251 | Tragic 64.4% |
| Immigrants | Dominican Republic | 1.5 /100 | #252 | Tragic 64.4% |
| Czechoslovakians | 1.4 /100 | #253 | Tragic 64.3% |
| Immigrants | Uzbekistan | 1.4 /100 | #254 | Tragic 64.3% |
| Hispanics or Latinos | 1.1 /100 | #255 | Tragic 64.3% |
| Immigrants | Mexico | 1.0 /100 | #256 | Tragic 64.3% |
| Inupiat | 0.8 /100 | #257 | Tragic 64.3% |
| Immigrants | Scotland | 0.8 /100 | #258 | Tragic 64.2% |
| Immigrants | Western Europe | 0.7 /100 | #259 | Tragic 64.2% |