Immigrants from Uganda vs Japanese In Labor Force | Age > 16
COMPARE
Immigrants from Uganda
Japanese
In Labor Force | Age > 16
In Labor Force | Age > 16 Comparison
Immigrants from Uganda
Japanese
67.5%
IN LABOR FORCE | AGE > 16
100.0/ 100
METRIC RATING
22nd/ 347
METRIC RANK
65.8%
IN LABOR FORCE | AGE > 16
97.7/ 100
METRIC RATING
110th/ 347
METRIC RANK
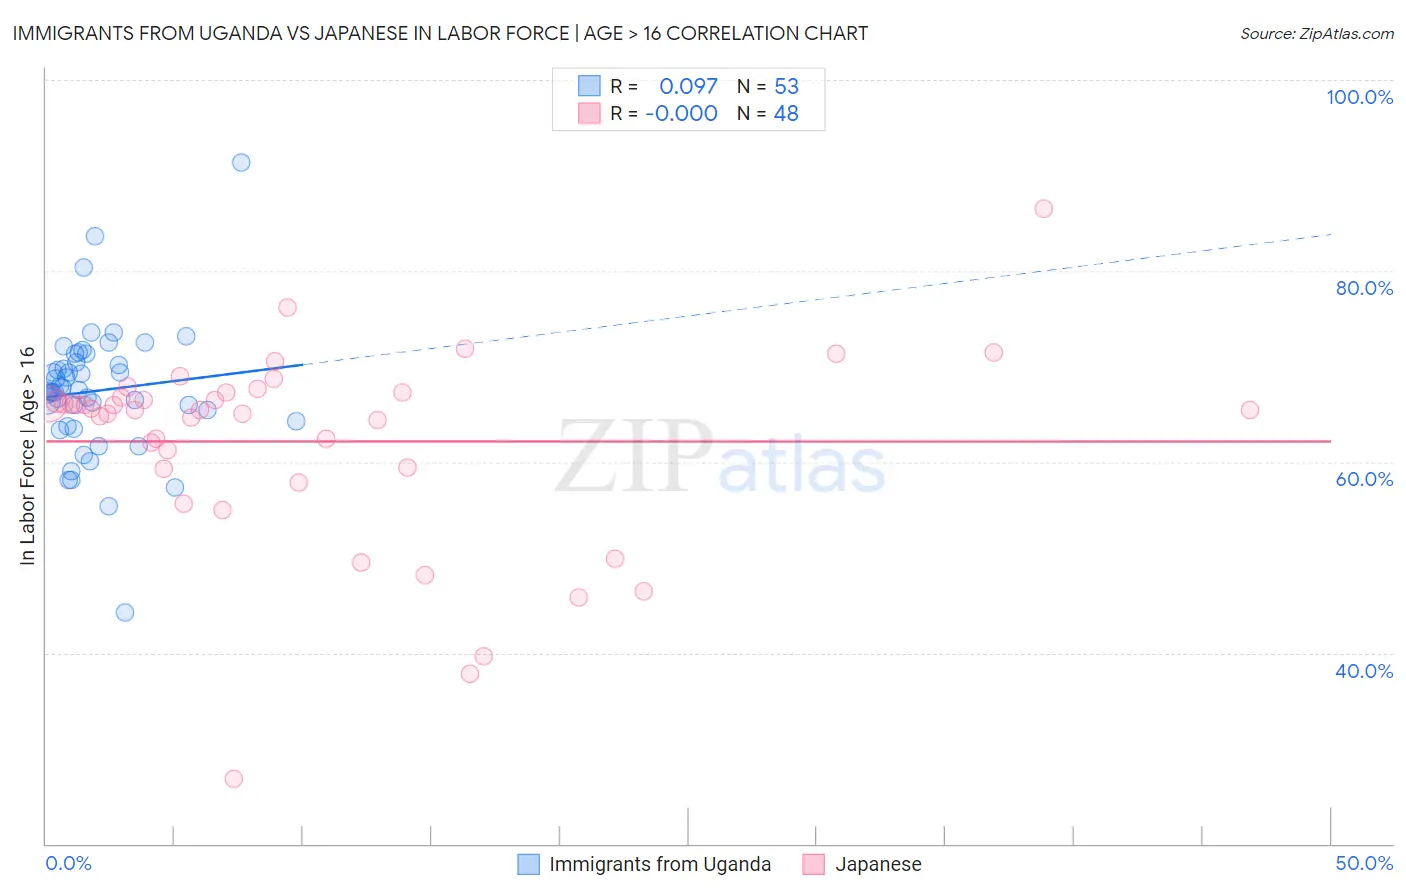
Immigrants from Uganda vs Japanese In Labor Force | Age > 16 Correlation Chart
The statistical analysis conducted on geographies consisting of 125,982,197 people shows a slight positive correlation between the proportion of Immigrants from Uganda and labor force participation rate among population ages 16 and over in the United States with a correlation coefficient (R) of 0.097 and weighted average of 67.5%. Similarly, the statistical analysis conducted on geographies consisting of 249,190,051 people shows no correlation between the proportion of Japanese and labor force participation rate among population ages 16 and over in the United States with a correlation coefficient (R) of -0.000 and weighted average of 65.8%, a difference of 2.6%.
In Labor Force | Age > 16 Correlation Summary
| Measurement | Immigrants from Uganda | Japanese |
| Minimum | 44.2% | 26.8% |
| Maximum | 91.4% | 86.5% |
| Range | 47.2% | 59.7% |
| Mean | 67.4% | 62.1% |
| Median | 67.4% | 65.4% |
| Interquartile 25% (IQ1) | 64.0% | 59.4% |
| Interquartile 75% (IQ3) | 70.8% | 67.0% |
| Interquartile Range (IQR) | 6.8% | 7.6% |
| Standard Deviation (Sample) | 7.0% | 10.4% |
| Standard Deviation (Population) | 6.9% | 10.3% |
Similar Demographics by In Labor Force | Age > 16
Demographics Similar to Immigrants from Uganda by In Labor Force | Age > 16
In terms of in labor force | age > 16, the demographic groups most similar to Immigrants from Uganda are Tongan (67.5%, a difference of 0.060%), Immigrants from Kenya (67.6%, a difference of 0.080%), Cambodian (67.4%, a difference of 0.12%), Kenyan (67.6%, a difference of 0.13%), and Immigrants from Liberia (67.6%, a difference of 0.16%).
| Demographics | Rating | Rank | In Labor Force | Age > 16 |
| Immigrants | Middle Africa | 100.0 /100 | #15 | Exceptional 67.7% |
| Immigrants | Sudan | 100.0 /100 | #16 | Exceptional 67.7% |
| Immigrants | India | 100.0 /100 | #17 | Exceptional 67.6% |
| Immigrants | Liberia | 100.0 /100 | #18 | Exceptional 67.6% |
| Kenyans | 100.0 /100 | #19 | Exceptional 67.6% |
| Immigrants | Kenya | 100.0 /100 | #20 | Exceptional 67.6% |
| Tongans | 100.0 /100 | #21 | Exceptional 67.5% |
| Immigrants | Uganda | 100.0 /100 | #22 | Exceptional 67.5% |
| Cambodians | 100.0 /100 | #23 | Exceptional 67.4% |
| Ugandans | 100.0 /100 | #24 | Exceptional 67.4% |
| Immigrants | Africa | 100.0 /100 | #25 | Exceptional 67.4% |
| Immigrants | Cabo Verde | 100.0 /100 | #26 | Exceptional 67.3% |
| Zimbabweans | 100.0 /100 | #27 | Exceptional 67.3% |
| Immigrants | Morocco | 100.0 /100 | #28 | Exceptional 67.2% |
| Thais | 100.0 /100 | #29 | Exceptional 67.2% |
Demographics Similar to Japanese by In Labor Force | Age > 16
In terms of in labor force | age > 16, the demographic groups most similar to Japanese are Immigrants from Honduras (65.8%, a difference of 0.020%), Immigrants from Spain (65.8%, a difference of 0.040%), Immigrants from Japan (65.8%, a difference of 0.040%), Laotian (65.8%, a difference of 0.040%), and Immigrants from Poland (65.8%, a difference of 0.050%).
| Demographics | Rating | Rank | In Labor Force | Age > 16 |
| Immigrants | South Eastern Asia | 98.5 /100 | #103 | Exceptional 65.9% |
| Palestinians | 98.5 /100 | #104 | Exceptional 65.9% |
| Colombians | 98.4 /100 | #105 | Exceptional 65.9% |
| Immigrants | Serbia | 98.1 /100 | #106 | Exceptional 65.8% |
| Immigrants | Poland | 98.1 /100 | #107 | Exceptional 65.8% |
| Immigrants | Spain | 98.0 /100 | #108 | Exceptional 65.8% |
| Immigrants | Japan | 98.0 /100 | #109 | Exceptional 65.8% |
| Japanese | 97.7 /100 | #110 | Exceptional 65.8% |
| Immigrants | Honduras | 97.5 /100 | #111 | Exceptional 65.8% |
| Laotians | 97.4 /100 | #112 | Exceptional 65.8% |
| Pakistanis | 97.1 /100 | #113 | Exceptional 65.8% |
| Hondurans | 97.1 /100 | #114 | Exceptional 65.8% |
| Immigrants | Indonesia | 96.8 /100 | #115 | Exceptional 65.7% |
| Argentineans | 96.7 /100 | #116 | Exceptional 65.7% |
| Immigrants | Iran | 96.6 /100 | #117 | Exceptional 65.7% |