Immigrants from Uganda vs Immigrants from Uruguay In Labor Force | Age > 16
COMPARE
Immigrants from Uganda
Immigrants from Uruguay
In Labor Force | Age > 16
In Labor Force | Age > 16 Comparison
Immigrants from Uganda
Immigrants from Uruguay
67.5%
IN LABOR FORCE | AGE > 16
100.0/ 100
METRIC RATING
22nd/ 347
METRIC RANK
66.0%
IN LABOR FORCE | AGE > 16
99.1/ 100
METRIC RATING
95th/ 347
METRIC RANK
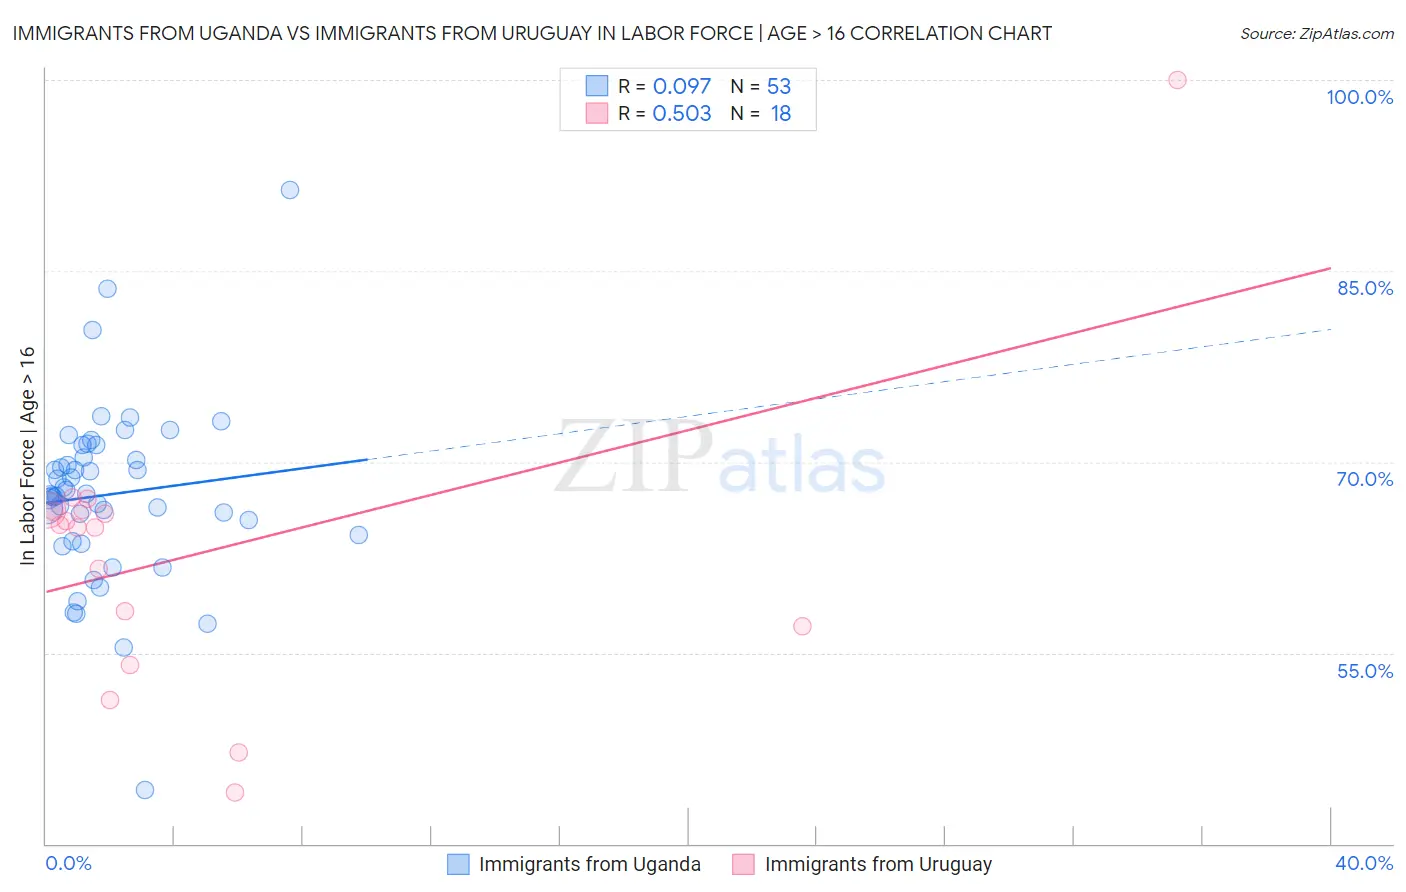
Immigrants from Uganda vs Immigrants from Uruguay In Labor Force | Age > 16 Correlation Chart
The statistical analysis conducted on geographies consisting of 125,982,197 people shows a slight positive correlation between the proportion of Immigrants from Uganda and labor force participation rate among population ages 16 and over in the United States with a correlation coefficient (R) of 0.097 and weighted average of 67.5%. Similarly, the statistical analysis conducted on geographies consisting of 133,256,636 people shows a substantial positive correlation between the proportion of Immigrants from Uruguay and labor force participation rate among population ages 16 and over in the United States with a correlation coefficient (R) of 0.503 and weighted average of 66.0%, a difference of 2.3%.
In Labor Force | Age > 16 Correlation Summary
| Measurement | Immigrants from Uganda | Immigrants from Uruguay |
| Minimum | 44.2% | 44.0% |
| Maximum | 91.4% | 100.0% |
| Range | 47.2% | 56.0% |
| Mean | 67.4% | 62.9% |
| Median | 67.4% | 64.9% |
| Interquartile 25% (IQ1) | 64.0% | 57.1% |
| Interquartile 75% (IQ3) | 70.8% | 66.2% |
| Interquartile Range (IQR) | 6.8% | 9.1% |
| Standard Deviation (Sample) | 7.0% | 11.7% |
| Standard Deviation (Population) | 6.9% | 11.4% |
Similar Demographics by In Labor Force | Age > 16
Demographics Similar to Immigrants from Uganda by In Labor Force | Age > 16
In terms of in labor force | age > 16, the demographic groups most similar to Immigrants from Uganda are Tongan (67.5%, a difference of 0.060%), Immigrants from Kenya (67.6%, a difference of 0.080%), Cambodian (67.4%, a difference of 0.12%), Kenyan (67.6%, a difference of 0.13%), and Immigrants from Liberia (67.6%, a difference of 0.16%).
| Demographics | Rating | Rank | In Labor Force | Age > 16 |
| Immigrants | Middle Africa | 100.0 /100 | #15 | Exceptional 67.7% |
| Immigrants | Sudan | 100.0 /100 | #16 | Exceptional 67.7% |
| Immigrants | India | 100.0 /100 | #17 | Exceptional 67.6% |
| Immigrants | Liberia | 100.0 /100 | #18 | Exceptional 67.6% |
| Kenyans | 100.0 /100 | #19 | Exceptional 67.6% |
| Immigrants | Kenya | 100.0 /100 | #20 | Exceptional 67.6% |
| Tongans | 100.0 /100 | #21 | Exceptional 67.5% |
| Immigrants | Uganda | 100.0 /100 | #22 | Exceptional 67.5% |
| Cambodians | 100.0 /100 | #23 | Exceptional 67.4% |
| Ugandans | 100.0 /100 | #24 | Exceptional 67.4% |
| Immigrants | Africa | 100.0 /100 | #25 | Exceptional 67.4% |
| Immigrants | Cabo Verde | 100.0 /100 | #26 | Exceptional 67.3% |
| Zimbabweans | 100.0 /100 | #27 | Exceptional 67.3% |
| Immigrants | Morocco | 100.0 /100 | #28 | Exceptional 67.2% |
| Thais | 100.0 /100 | #29 | Exceptional 67.2% |
Demographics Similar to Immigrants from Uruguay by In Labor Force | Age > 16
In terms of in labor force | age > 16, the demographic groups most similar to Immigrants from Uruguay are Immigrants from Cambodia (66.0%, a difference of 0.0%), Aleut (66.0%, a difference of 0.020%), Immigrants from South America (66.0%, a difference of 0.020%), Bangladeshi (65.9%, a difference of 0.040%), and Immigrants from Laos (66.0%, a difference of 0.050%).
| Demographics | Rating | Rank | In Labor Force | Age > 16 |
| Bermudans | 99.3 /100 | #88 | Exceptional 66.0% |
| Immigrants | Laos | 99.2 /100 | #89 | Exceptional 66.0% |
| Chileans | 99.2 /100 | #90 | Exceptional 66.0% |
| Iranians | 99.2 /100 | #91 | Exceptional 66.0% |
| Aleuts | 99.1 /100 | #92 | Exceptional 66.0% |
| Immigrants | South America | 99.1 /100 | #93 | Exceptional 66.0% |
| Immigrants | Cambodia | 99.1 /100 | #94 | Exceptional 66.0% |
| Immigrants | Uruguay | 99.1 /100 | #95 | Exceptional 66.0% |
| Bangladeshis | 98.9 /100 | #96 | Exceptional 65.9% |
| Filipinos | 98.9 /100 | #97 | Exceptional 65.9% |
| Immigrants | Chile | 98.7 /100 | #98 | Exceptional 65.9% |
| Immigrants | Australia | 98.7 /100 | #99 | Exceptional 65.9% |
| Okinawans | 98.7 /100 | #100 | Exceptional 65.9% |
| Immigrants | Colombia | 98.6 /100 | #101 | Exceptional 65.9% |
| Uruguayans | 98.6 /100 | #102 | Exceptional 65.9% |