Fijian vs Swedish In Labor Force | Age > 16
COMPARE
Fijian
Swedish
In Labor Force | Age > 16
In Labor Force | Age > 16 Comparison
Fijians
Swedes
64.8%
IN LABOR FORCE | AGE > 16
14.1/ 100
METRIC RATING
211th/ 347
METRIC RANK
65.1%
IN LABOR FORCE | AGE > 16
47.4/ 100
METRIC RATING
176th/ 347
METRIC RANK
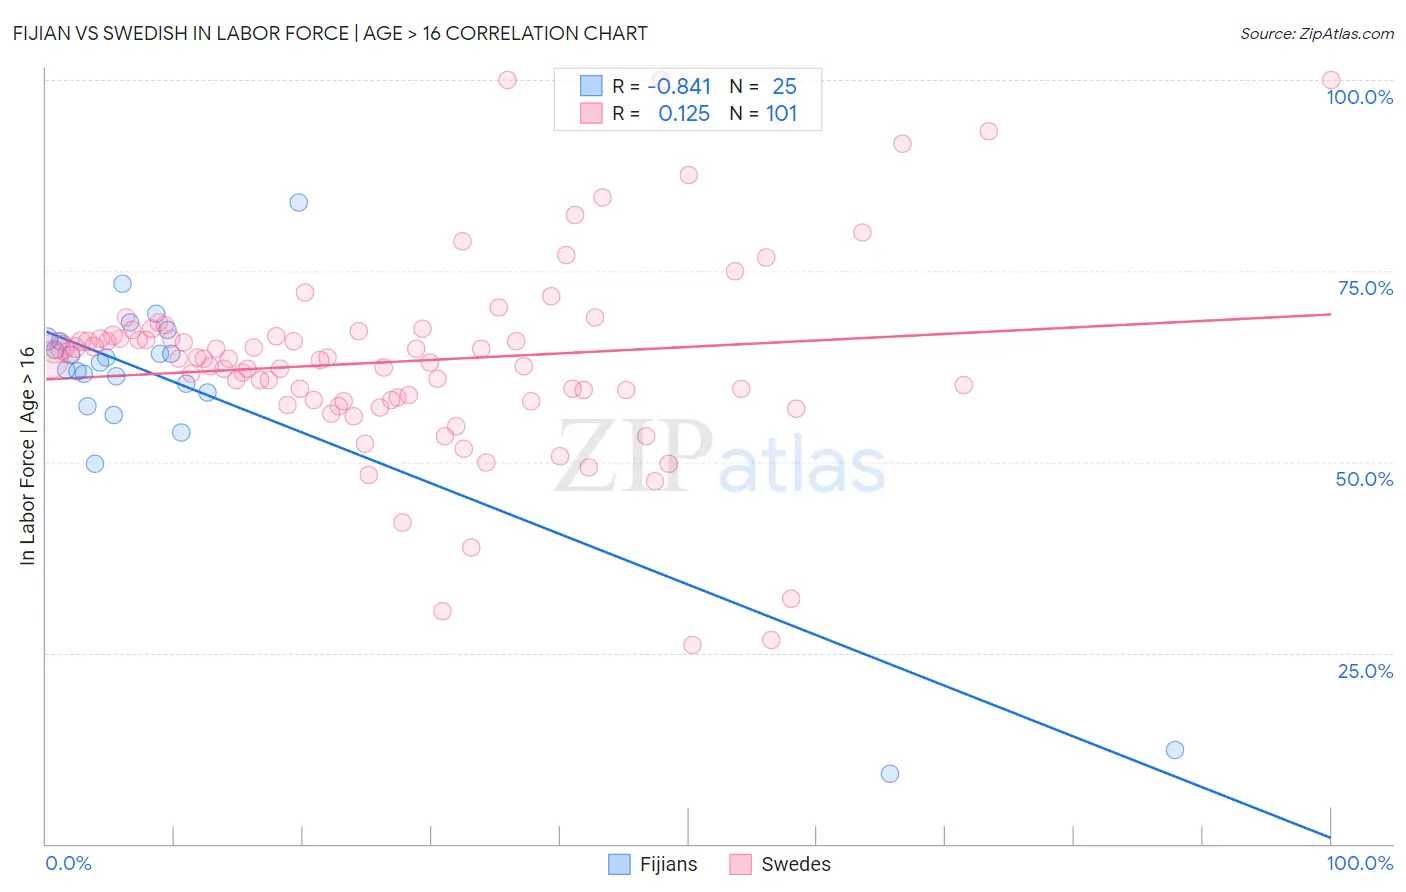
Fijian vs Swedish In Labor Force | Age > 16 Correlation Chart
The statistical analysis conducted on geographies consisting of 55,948,069 people shows a very strong negative correlation between the proportion of Fijians and labor force participation rate among population ages 16 and over in the United States with a correlation coefficient (R) of -0.841 and weighted average of 64.8%. Similarly, the statistical analysis conducted on geographies consisting of 539,248,336 people shows a poor positive correlation between the proportion of Swedes and labor force participation rate among population ages 16 and over in the United States with a correlation coefficient (R) of 0.125 and weighted average of 65.1%, a difference of 0.48%.
In Labor Force | Age > 16 Correlation Summary
| Measurement | Fijian | Swedish |
| Minimum | 9.1% | 26.0% |
| Maximum | 83.9% | 100.0% |
| Range | 74.8% | 74.0% |
| Mean | 59.3% | 63.1% |
| Median | 63.0% | 63.4% |
| Interquartile 25% (IQ1) | 58.2% | 58.0% |
| Interquartile 75% (IQ3) | 66.0% | 66.5% |
| Interquartile Range (IQR) | 7.7% | 8.5% |
| Standard Deviation (Sample) | 16.0% | 13.0% |
| Standard Deviation (Population) | 15.7% | 12.9% |
Similar Demographics by In Labor Force | Age > 16
Demographics Similar to Fijians by In Labor Force | Age > 16
In terms of in labor force | age > 16, the demographic groups most similar to Fijians are Immigrants from Denmark (64.8%, a difference of 0.010%), Alaskan Athabascan (64.8%, a difference of 0.010%), Maltese (64.8%, a difference of 0.010%), Estonian (64.8%, a difference of 0.020%), and Immigrants from Trinidad and Tobago (64.8%, a difference of 0.030%).
| Demographics | Rating | Rank | In Labor Force | Age > 16 |
| Slovenes | 18.7 /100 | #204 | Poor 64.9% |
| Jamaicans | 18.7 /100 | #205 | Poor 64.9% |
| Lithuanians | 17.4 /100 | #206 | Poor 64.8% |
| Immigrants | Latin America | 16.4 /100 | #207 | Poor 64.8% |
| Belizeans | 16.2 /100 | #208 | Poor 64.8% |
| Immigrants | Trinidad and Tobago | 15.6 /100 | #209 | Poor 64.8% |
| Immigrants | Denmark | 14.7 /100 | #210 | Poor 64.8% |
| Fijians | 14.1 /100 | #211 | Poor 64.8% |
| Alaskan Athabascans | 13.9 /100 | #212 | Poor 64.8% |
| Maltese | 13.8 /100 | #213 | Poor 64.8% |
| Estonians | 13.1 /100 | #214 | Poor 64.8% |
| Immigrants | Czechoslovakia | 12.3 /100 | #215 | Poor 64.8% |
| Belgians | 11.4 /100 | #216 | Poor 64.7% |
| U.S. Virgin Islanders | 11.3 /100 | #217 | Poor 64.7% |
| Alsatians | 10.7 /100 | #218 | Poor 64.7% |
Demographics Similar to Swedes by In Labor Force | Age > 16
In terms of in labor force | age > 16, the demographic groups most similar to Swedes are Eastern European (65.1%, a difference of 0.010%), Macedonian (65.1%, a difference of 0.030%), Nicaraguan (65.1%, a difference of 0.030%), Trinidadian and Tobagonian (65.1%, a difference of 0.030%), and Immigrants from Haiti (65.1%, a difference of 0.050%).
| Demographics | Rating | Rank | In Labor Force | Age > 16 |
| Arabs | 62.4 /100 | #169 | Good 65.2% |
| Immigrants | Israel | 61.7 /100 | #170 | Good 65.2% |
| Israelis | 61.6 /100 | #171 | Good 65.2% |
| Immigrants | Sweden | 61.3 /100 | #172 | Good 65.2% |
| Immigrants | Ukraine | 53.7 /100 | #173 | Average 65.1% |
| Macedonians | 50.0 /100 | #174 | Average 65.1% |
| Nicaraguans | 49.7 /100 | #175 | Average 65.1% |
| Swedes | 47.4 /100 | #176 | Average 65.1% |
| Eastern Europeans | 46.2 /100 | #177 | Average 65.1% |
| Trinidadians and Tobagonians | 45.2 /100 | #178 | Average 65.1% |
| Immigrants | Haiti | 43.3 /100 | #179 | Average 65.1% |
| Immigrants | Latvia | 42.9 /100 | #180 | Average 65.1% |
| Immigrants | Panama | 42.4 /100 | #181 | Average 65.1% |
| Immigrants | Nicaragua | 41.1 /100 | #182 | Average 65.1% |
| Soviet Union | 40.5 /100 | #183 | Average 65.0% |