Fijian vs Immigrants from Caribbean In Labor Force | Age > 16
COMPARE
Fijian
Immigrants from Caribbean
In Labor Force | Age > 16
In Labor Force | Age > 16 Comparison
Fijians
Immigrants from Caribbean
64.8%
IN LABOR FORCE | AGE > 16
14.1/ 100
METRIC RATING
211th/ 347
METRIC RANK
64.4%
IN LABOR FORCE | AGE > 16
2.3/ 100
METRIC RATING
246th/ 347
METRIC RANK
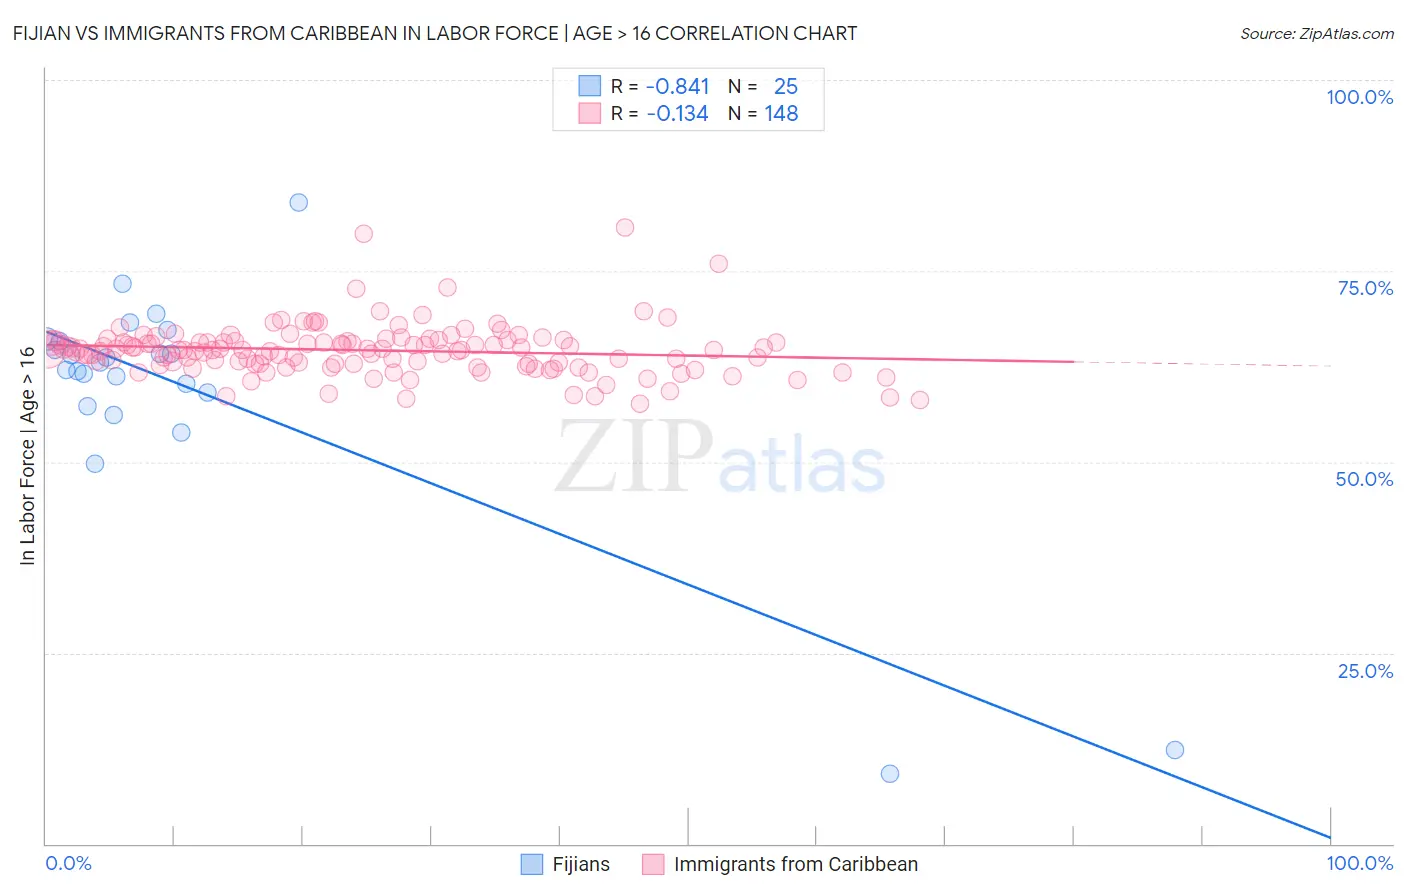
Fijian vs Immigrants from Caribbean In Labor Force | Age > 16 Correlation Chart
The statistical analysis conducted on geographies consisting of 55,948,069 people shows a very strong negative correlation between the proportion of Fijians and labor force participation rate among population ages 16 and over in the United States with a correlation coefficient (R) of -0.841 and weighted average of 64.8%. Similarly, the statistical analysis conducted on geographies consisting of 450,044,170 people shows a poor negative correlation between the proportion of Immigrants from Caribbean and labor force participation rate among population ages 16 and over in the United States with a correlation coefficient (R) of -0.134 and weighted average of 64.4%, a difference of 0.55%.
In Labor Force | Age > 16 Correlation Summary
| Measurement | Fijian | Immigrants from Caribbean |
| Minimum | 9.1% | 57.6% |
| Maximum | 83.9% | 80.7% |
| Range | 74.8% | 23.1% |
| Mean | 59.3% | 64.6% |
| Median | 63.0% | 64.7% |
| Interquartile 25% (IQ1) | 58.2% | 62.8% |
| Interquartile 75% (IQ3) | 66.0% | 65.8% |
| Interquartile Range (IQR) | 7.7% | 3.0% |
| Standard Deviation (Sample) | 16.0% | 3.4% |
| Standard Deviation (Population) | 15.7% | 3.3% |
Similar Demographics by In Labor Force | Age > 16
Demographics Similar to Fijians by In Labor Force | Age > 16
In terms of in labor force | age > 16, the demographic groups most similar to Fijians are Immigrants from Denmark (64.8%, a difference of 0.010%), Alaskan Athabascan (64.8%, a difference of 0.010%), Maltese (64.8%, a difference of 0.010%), Estonian (64.8%, a difference of 0.020%), and Immigrants from Trinidad and Tobago (64.8%, a difference of 0.030%).
| Demographics | Rating | Rank | In Labor Force | Age > 16 |
| Slovenes | 18.7 /100 | #204 | Poor 64.9% |
| Jamaicans | 18.7 /100 | #205 | Poor 64.9% |
| Lithuanians | 17.4 /100 | #206 | Poor 64.8% |
| Immigrants | Latin America | 16.4 /100 | #207 | Poor 64.8% |
| Belizeans | 16.2 /100 | #208 | Poor 64.8% |
| Immigrants | Trinidad and Tobago | 15.6 /100 | #209 | Poor 64.8% |
| Immigrants | Denmark | 14.7 /100 | #210 | Poor 64.8% |
| Fijians | 14.1 /100 | #211 | Poor 64.8% |
| Alaskan Athabascans | 13.9 /100 | #212 | Poor 64.8% |
| Maltese | 13.8 /100 | #213 | Poor 64.8% |
| Estonians | 13.1 /100 | #214 | Poor 64.8% |
| Immigrants | Czechoslovakia | 12.3 /100 | #215 | Poor 64.8% |
| Belgians | 11.4 /100 | #216 | Poor 64.7% |
| U.S. Virgin Islanders | 11.3 /100 | #217 | Poor 64.7% |
| Alsatians | 10.7 /100 | #218 | Poor 64.7% |
Demographics Similar to Immigrants from Caribbean by In Labor Force | Age > 16
In terms of in labor force | age > 16, the demographic groups most similar to Immigrants from Caribbean are Swiss (64.4%, a difference of 0.020%), Immigrants from Barbados (64.4%, a difference of 0.030%), German (64.4%, a difference of 0.060%), British West Indian (64.4%, a difference of 0.070%), and West Indian (64.5%, a difference of 0.080%).
| Demographics | Rating | Rank | In Labor Force | Age > 16 |
| Immigrants | Hungary | 3.8 /100 | #239 | Tragic 64.5% |
| Immigrants | Bangladesh | 3.6 /100 | #240 | Tragic 64.5% |
| Immigrants | Dominica | 3.5 /100 | #241 | Tragic 64.5% |
| Immigrants | Netherlands | 3.4 /100 | #242 | Tragic 64.5% |
| Immigrants | Lebanon | 3.2 /100 | #243 | Tragic 64.5% |
| Tsimshian | 3.1 /100 | #244 | Tragic 64.5% |
| West Indians | 3.0 /100 | #245 | Tragic 64.5% |
| Immigrants | Caribbean | 2.3 /100 | #246 | Tragic 64.4% |
| Swiss | 2.1 /100 | #247 | Tragic 64.4% |
| Immigrants | Barbados | 2.1 /100 | #248 | Tragic 64.4% |
| Germans | 1.8 /100 | #249 | Tragic 64.4% |
| British West Indians | 1.8 /100 | #250 | Tragic 64.4% |
| Portuguese | 1.6 /100 | #251 | Tragic 64.4% |
| Immigrants | Dominican Republic | 1.5 /100 | #252 | Tragic 64.4% |
| Czechoslovakians | 1.4 /100 | #253 | Tragic 64.3% |