Fijian vs Spaniard In Labor Force | Age > 16
COMPARE
Fijian
Spaniard
In Labor Force | Age > 16
In Labor Force | Age > 16 Comparison
Fijians
Spaniards
64.8%
IN LABOR FORCE | AGE > 16
14.1/ 100
METRIC RATING
211th/ 347
METRIC RANK
64.1%
IN LABOR FORCE | AGE > 16
0.5/ 100
METRIC RATING
268th/ 347
METRIC RANK
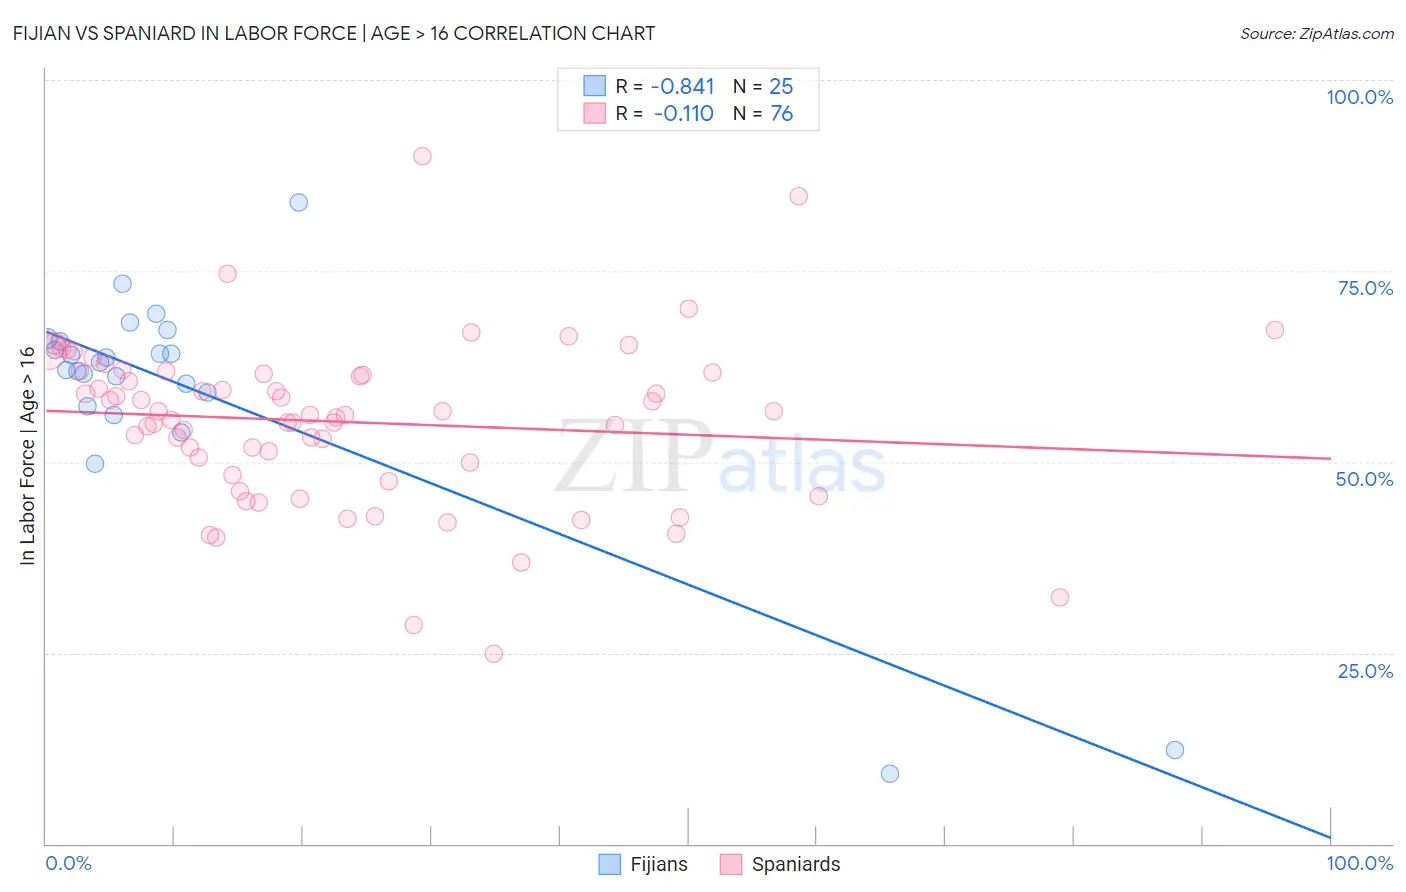
Fijian vs Spaniard In Labor Force | Age > 16 Correlation Chart
The statistical analysis conducted on geographies consisting of 55,948,069 people shows a very strong negative correlation between the proportion of Fijians and labor force participation rate among population ages 16 and over in the United States with a correlation coefficient (R) of -0.841 and weighted average of 64.8%. Similarly, the statistical analysis conducted on geographies consisting of 443,548,317 people shows a poor negative correlation between the proportion of Spaniards and labor force participation rate among population ages 16 and over in the United States with a correlation coefficient (R) of -0.110 and weighted average of 64.1%, a difference of 1.0%.
In Labor Force | Age > 16 Correlation Summary
| Measurement | Fijian | Spaniard |
| Minimum | 9.1% | 24.9% |
| Maximum | 83.9% | 90.0% |
| Range | 74.8% | 65.1% |
| Mean | 59.3% | 55.2% |
| Median | 63.0% | 56.2% |
| Interquartile 25% (IQ1) | 58.2% | 49.1% |
| Interquartile 75% (IQ3) | 66.0% | 61.6% |
| Interquartile Range (IQR) | 7.7% | 12.5% |
| Standard Deviation (Sample) | 16.0% | 10.9% |
| Standard Deviation (Population) | 15.7% | 10.8% |
Similar Demographics by In Labor Force | Age > 16
Demographics Similar to Fijians by In Labor Force | Age > 16
In terms of in labor force | age > 16, the demographic groups most similar to Fijians are Immigrants from Denmark (64.8%, a difference of 0.010%), Alaskan Athabascan (64.8%, a difference of 0.010%), Maltese (64.8%, a difference of 0.010%), Estonian (64.8%, a difference of 0.020%), and Immigrants from Trinidad and Tobago (64.8%, a difference of 0.030%).
| Demographics | Rating | Rank | In Labor Force | Age > 16 |
| Slovenes | 18.7 /100 | #204 | Poor 64.9% |
| Jamaicans | 18.7 /100 | #205 | Poor 64.9% |
| Lithuanians | 17.4 /100 | #206 | Poor 64.8% |
| Immigrants | Latin America | 16.4 /100 | #207 | Poor 64.8% |
| Belizeans | 16.2 /100 | #208 | Poor 64.8% |
| Immigrants | Trinidad and Tobago | 15.6 /100 | #209 | Poor 64.8% |
| Immigrants | Denmark | 14.7 /100 | #210 | Poor 64.8% |
| Fijians | 14.1 /100 | #211 | Poor 64.8% |
| Alaskan Athabascans | 13.9 /100 | #212 | Poor 64.8% |
| Maltese | 13.8 /100 | #213 | Poor 64.8% |
| Estonians | 13.1 /100 | #214 | Poor 64.8% |
| Immigrants | Czechoslovakia | 12.3 /100 | #215 | Poor 64.8% |
| Belgians | 11.4 /100 | #216 | Poor 64.7% |
| U.S. Virgin Islanders | 11.3 /100 | #217 | Poor 64.7% |
| Alsatians | 10.7 /100 | #218 | Poor 64.7% |
Demographics Similar to Spaniards by In Labor Force | Age > 16
In terms of in labor force | age > 16, the demographic groups most similar to Spaniards are Canadian (64.1%, a difference of 0.0%), Immigrants from England (64.2%, a difference of 0.010%), Cuban (64.2%, a difference of 0.020%), Irish (64.1%, a difference of 0.040%), and Dutch (64.2%, a difference of 0.060%).
| Demographics | Rating | Rank | In Labor Force | Age > 16 |
| Basques | 0.7 /100 | #261 | Tragic 64.2% |
| Finns | 0.7 /100 | #262 | Tragic 64.2% |
| Bahamians | 0.6 /100 | #263 | Tragic 64.2% |
| Dutch | 0.6 /100 | #264 | Tragic 64.2% |
| Cubans | 0.5 /100 | #265 | Tragic 64.2% |
| Immigrants | England | 0.5 /100 | #266 | Tragic 64.2% |
| Canadians | 0.5 /100 | #267 | Tragic 64.1% |
| Spaniards | 0.5 /100 | #268 | Tragic 64.1% |
| Irish | 0.4 /100 | #269 | Tragic 64.1% |
| Guyanese | 0.4 /100 | #270 | Tragic 64.1% |
| Dominicans | 0.4 /100 | #271 | Tragic 64.1% |
| Native Hawaiians | 0.3 /100 | #272 | Tragic 64.1% |
| Hmong | 0.3 /100 | #273 | Tragic 64.1% |
| Immigrants | Cuba | 0.3 /100 | #274 | Tragic 64.1% |
| Mexicans | 0.3 /100 | #275 | Tragic 64.1% |