Immigrants from Argentina vs Brazilian In Labor Force | Age > 16
COMPARE
Immigrants from Argentina
Brazilian
In Labor Force | Age > 16
In Labor Force | Age > 16 Comparison
Immigrants from Argentina
Brazilians
65.6%
IN LABOR FORCE | AGE > 16
92.4/ 100
METRIC RATING
136th/ 347
METRIC RANK
66.6%
IN LABOR FORCE | AGE > 16
100.0/ 100
METRIC RATING
46th/ 347
METRIC RANK
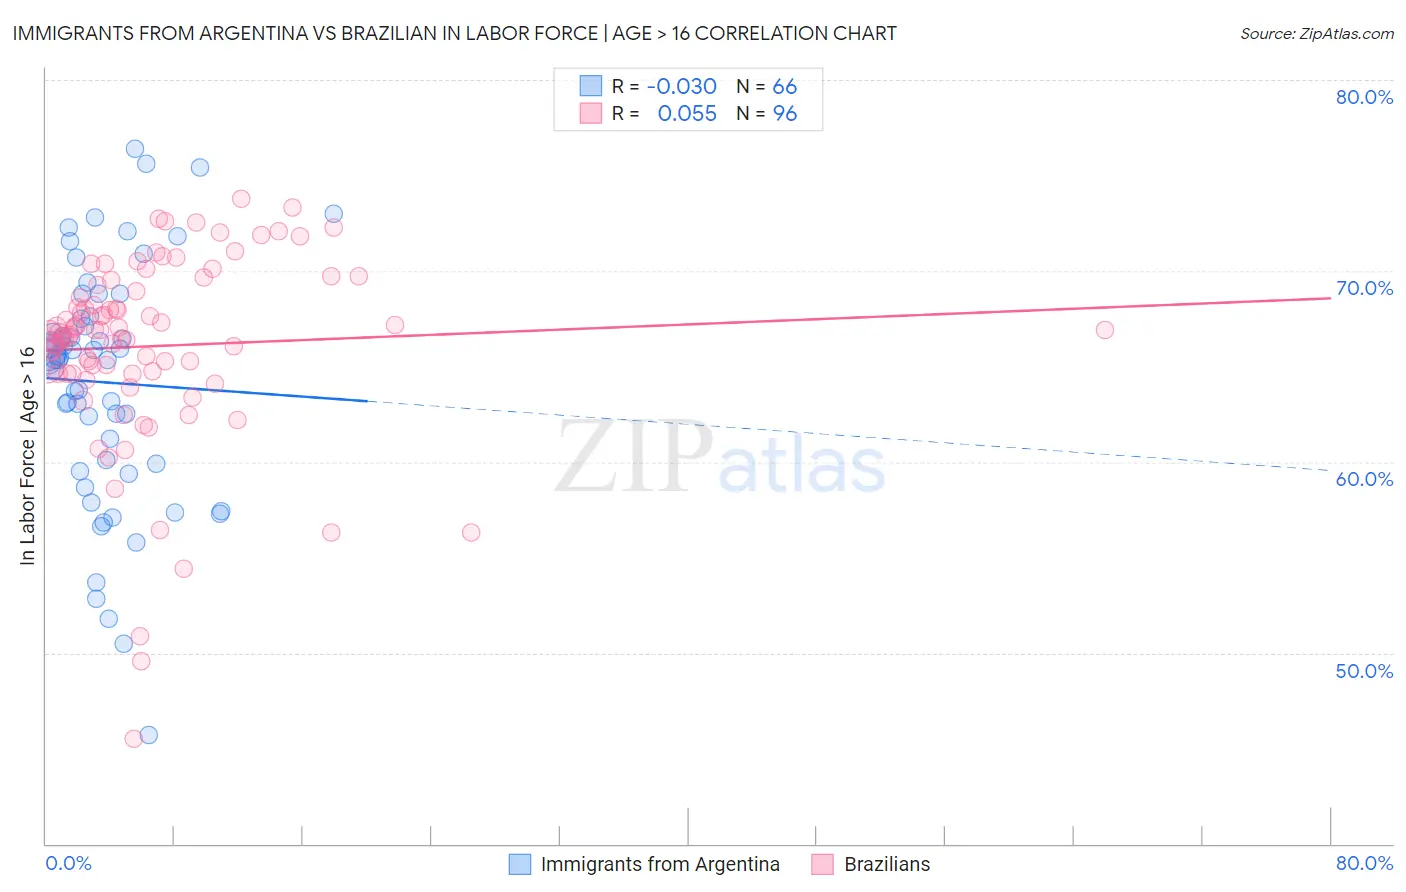
Immigrants from Argentina vs Brazilian In Labor Force | Age > 16 Correlation Chart
The statistical analysis conducted on geographies consisting of 264,438,134 people shows no correlation between the proportion of Immigrants from Argentina and labor force participation rate among population ages 16 and over in the United States with a correlation coefficient (R) of -0.030 and weighted average of 65.6%. Similarly, the statistical analysis conducted on geographies consisting of 323,965,381 people shows a slight positive correlation between the proportion of Brazilians and labor force participation rate among population ages 16 and over in the United States with a correlation coefficient (R) of 0.055 and weighted average of 66.6%, a difference of 1.6%.
In Labor Force | Age > 16 Correlation Summary
| Measurement | Immigrants from Argentina | Brazilian |
| Minimum | 45.7% | 45.5% |
| Maximum | 76.4% | 73.8% |
| Range | 30.7% | 28.3% |
| Mean | 64.2% | 66.1% |
| Median | 65.4% | 66.8% |
| Interquartile 25% (IQ1) | 59.9% | 64.6% |
| Interquartile 75% (IQ3) | 67.5% | 69.1% |
| Interquartile Range (IQR) | 7.6% | 4.5% |
| Standard Deviation (Sample) | 6.3% | 5.0% |
| Standard Deviation (Population) | 6.2% | 4.9% |
Similar Demographics by In Labor Force | Age > 16
Demographics Similar to Immigrants from Argentina by In Labor Force | Age > 16
In terms of in labor force | age > 16, the demographic groups most similar to Immigrants from Argentina are Guatemalan (65.6%, a difference of 0.0%), Guamanian/Chamorro (65.6%, a difference of 0.0%), Immigrants from West Indies (65.6%, a difference of 0.020%), Costa Rican (65.6%, a difference of 0.030%), and Immigrants from Lithuania (65.6%, a difference of 0.040%).
| Demographics | Rating | Rank | In Labor Force | Age > 16 |
| Immigrants | Philippines | 94.5 /100 | #129 | Exceptional 65.6% |
| Immigrants | Guatemala | 94.4 /100 | #130 | Exceptional 65.6% |
| Icelanders | 94.3 /100 | #131 | Exceptional 65.6% |
| Immigrants | North Macedonia | 94.1 /100 | #132 | Exceptional 65.6% |
| Immigrants | Lithuania | 93.5 /100 | #133 | Exceptional 65.6% |
| Costa Ricans | 93.2 /100 | #134 | Exceptional 65.6% |
| Guatemalans | 92.5 /100 | #135 | Exceptional 65.6% |
| Immigrants | Argentina | 92.4 /100 | #136 | Exceptional 65.6% |
| Guamanians/Chamorros | 92.4 /100 | #137 | Exceptional 65.6% |
| Immigrants | West Indies | 92.0 /100 | #138 | Exceptional 65.6% |
| Immigrants | Taiwan | 90.8 /100 | #139 | Exceptional 65.5% |
| Immigrants | Costa Rica | 90.8 /100 | #140 | Exceptional 65.5% |
| Samoans | 90.5 /100 | #141 | Exceptional 65.5% |
| Indians (Asian) | 89.5 /100 | #142 | Excellent 65.5% |
| Latvians | 89.4 /100 | #143 | Excellent 65.5% |
Demographics Similar to Brazilians by In Labor Force | Age > 16
In terms of in labor force | age > 16, the demographic groups most similar to Brazilians are Immigrants from Bulgaria (66.6%, a difference of 0.0%), Nigerian (66.6%, a difference of 0.010%), Immigrants from Northern Africa (66.6%, a difference of 0.030%), Immigrants from Brazil (66.7%, a difference of 0.070%), and Cape Verdean (66.6%, a difference of 0.080%).
| Demographics | Rating | Rank | In Labor Force | Age > 16 |
| Salvadorans | 100.0 /100 | #39 | Exceptional 66.8% |
| Immigrants | El Salvador | 100.0 /100 | #40 | Exceptional 66.8% |
| Immigrants | Zimbabwe | 100.0 /100 | #41 | Exceptional 66.8% |
| Senegalese | 100.0 /100 | #42 | Exceptional 66.7% |
| Luxembourgers | 100.0 /100 | #43 | Exceptional 66.7% |
| Immigrants | Pakistan | 100.0 /100 | #44 | Exceptional 66.7% |
| Immigrants | Brazil | 100.0 /100 | #45 | Exceptional 66.7% |
| Brazilians | 100.0 /100 | #46 | Exceptional 66.6% |
| Immigrants | Bulgaria | 100.0 /100 | #47 | Exceptional 66.6% |
| Nigerians | 100.0 /100 | #48 | Exceptional 66.6% |
| Immigrants | Northern Africa | 100.0 /100 | #49 | Exceptional 66.6% |
| Cape Verdeans | 100.0 /100 | #50 | Exceptional 66.6% |
| Immigrants | Kuwait | 100.0 /100 | #51 | Exceptional 66.5% |
| Paraguayans | 99.9 /100 | #52 | Exceptional 66.5% |
| Immigrants | Sri Lanka | 99.9 /100 | #53 | Exceptional 66.5% |