Apache vs Brazilian In Labor Force | Age > 16
COMPARE
Apache
Brazilian
In Labor Force | Age > 16
In Labor Force | Age > 16 Comparison
Apache
Brazilians
60.7%
IN LABOR FORCE | AGE > 16
0.0/ 100
METRIC RATING
334th/ 347
METRIC RANK
66.6%
IN LABOR FORCE | AGE > 16
100.0/ 100
METRIC RATING
46th/ 347
METRIC RANK
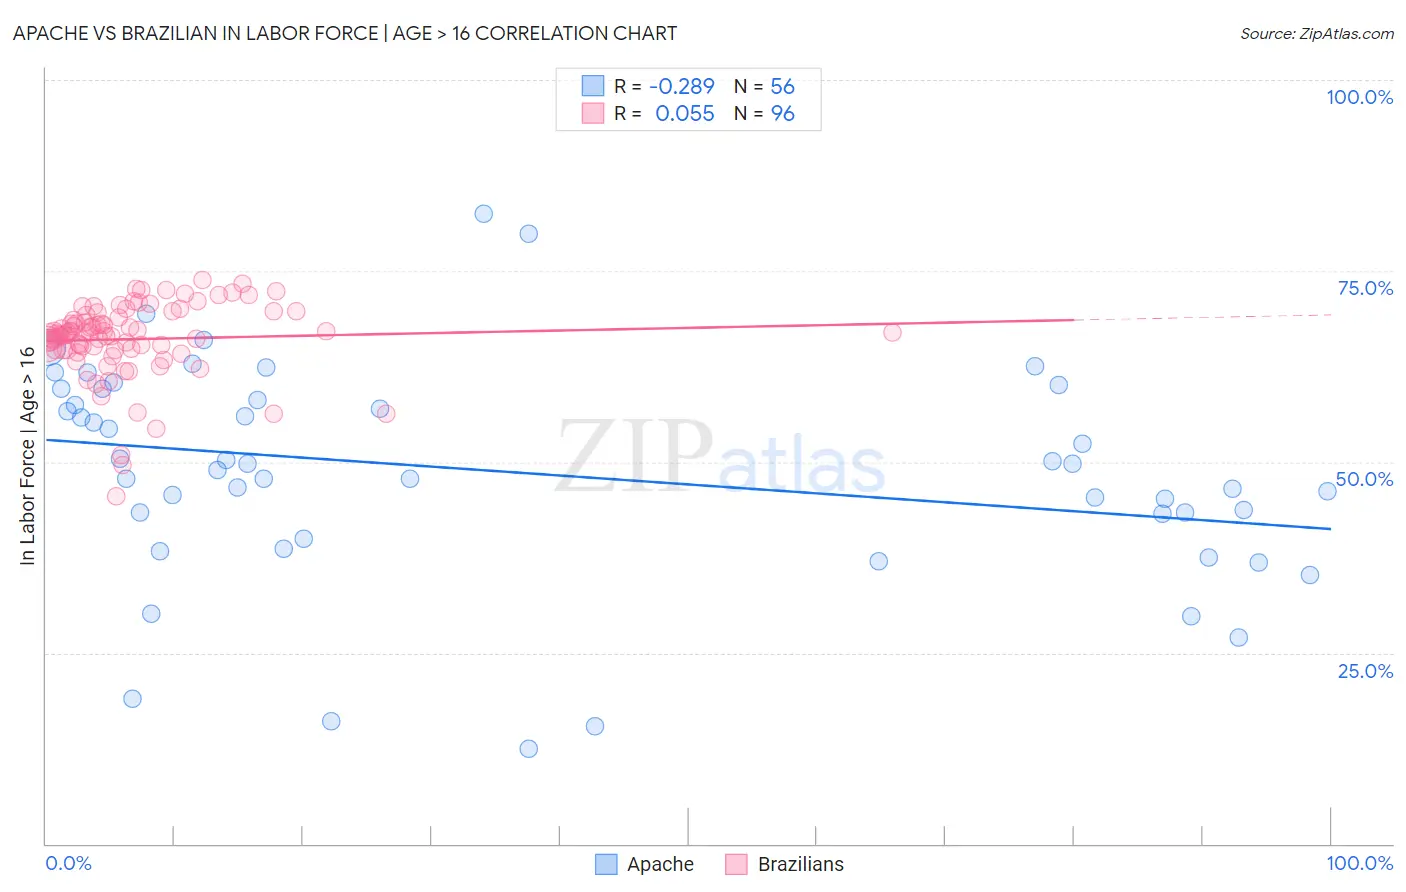
Apache vs Brazilian In Labor Force | Age > 16 Correlation Chart
The statistical analysis conducted on geographies consisting of 231,124,853 people shows a weak negative correlation between the proportion of Apache and labor force participation rate among population ages 16 and over in the United States with a correlation coefficient (R) of -0.289 and weighted average of 60.7%. Similarly, the statistical analysis conducted on geographies consisting of 323,965,381 people shows a slight positive correlation between the proportion of Brazilians and labor force participation rate among population ages 16 and over in the United States with a correlation coefficient (R) of 0.055 and weighted average of 66.6%, a difference of 9.7%.
In Labor Force | Age > 16 Correlation Summary
| Measurement | Apache | Brazilian |
| Minimum | 12.5% | 45.5% |
| Maximum | 82.5% | 73.8% |
| Range | 70.0% | 28.3% |
| Mean | 48.6% | 66.1% |
| Median | 49.3% | 66.8% |
| Interquartile 25% (IQ1) | 41.6% | 64.6% |
| Interquartile 75% (IQ3) | 58.8% | 69.1% |
| Interquartile Range (IQR) | 17.2% | 4.5% |
| Standard Deviation (Sample) | 14.5% | 5.0% |
| Standard Deviation (Population) | 14.4% | 4.9% |
Similar Demographics by In Labor Force | Age > 16
Demographics Similar to Apache by In Labor Force | Age > 16
In terms of in labor force | age > 16, the demographic groups most similar to Apache are Paiute (60.7%, a difference of 0.050%), Crow (60.8%, a difference of 0.13%), Native/Alaskan (60.6%, a difference of 0.19%), Menominee (60.6%, a difference of 0.21%), and Ute (60.9%, a difference of 0.30%).
| Demographics | Rating | Rank | In Labor Force | Age > 16 |
| Cajuns | 0.0 /100 | #327 | Tragic 61.8% |
| Dutch West Indians | 0.0 /100 | #328 | Tragic 61.7% |
| Choctaw | 0.0 /100 | #329 | Tragic 61.5% |
| Creek | 0.0 /100 | #330 | Tragic 61.3% |
| Ute | 0.0 /100 | #331 | Tragic 60.9% |
| Crow | 0.0 /100 | #332 | Tragic 60.8% |
| Paiute | 0.0 /100 | #333 | Tragic 60.7% |
| Apache | 0.0 /100 | #334 | Tragic 60.7% |
| Natives/Alaskans | 0.0 /100 | #335 | Tragic 60.6% |
| Menominee | 0.0 /100 | #336 | Tragic 60.6% |
| Colville | 0.0 /100 | #337 | Tragic 59.8% |
| Immigrants | Yemen | 0.0 /100 | #338 | Tragic 59.6% |
| Houma | 0.0 /100 | #339 | Tragic 59.5% |
| Pueblo | 0.0 /100 | #340 | Tragic 59.3% |
| Hopi | 0.0 /100 | #341 | Tragic 58.4% |
Demographics Similar to Brazilians by In Labor Force | Age > 16
In terms of in labor force | age > 16, the demographic groups most similar to Brazilians are Immigrants from Bulgaria (66.6%, a difference of 0.0%), Nigerian (66.6%, a difference of 0.010%), Immigrants from Northern Africa (66.6%, a difference of 0.030%), Immigrants from Brazil (66.7%, a difference of 0.070%), and Cape Verdean (66.6%, a difference of 0.080%).
| Demographics | Rating | Rank | In Labor Force | Age > 16 |
| Salvadorans | 100.0 /100 | #39 | Exceptional 66.8% |
| Immigrants | El Salvador | 100.0 /100 | #40 | Exceptional 66.8% |
| Immigrants | Zimbabwe | 100.0 /100 | #41 | Exceptional 66.8% |
| Senegalese | 100.0 /100 | #42 | Exceptional 66.7% |
| Luxembourgers | 100.0 /100 | #43 | Exceptional 66.7% |
| Immigrants | Pakistan | 100.0 /100 | #44 | Exceptional 66.7% |
| Immigrants | Brazil | 100.0 /100 | #45 | Exceptional 66.7% |
| Brazilians | 100.0 /100 | #46 | Exceptional 66.6% |
| Immigrants | Bulgaria | 100.0 /100 | #47 | Exceptional 66.6% |
| Nigerians | 100.0 /100 | #48 | Exceptional 66.6% |
| Immigrants | Northern Africa | 100.0 /100 | #49 | Exceptional 66.6% |
| Cape Verdeans | 100.0 /100 | #50 | Exceptional 66.6% |
| Immigrants | Kuwait | 100.0 /100 | #51 | Exceptional 66.5% |
| Paraguayans | 99.9 /100 | #52 | Exceptional 66.5% |
| Immigrants | Sri Lanka | 99.9 /100 | #53 | Exceptional 66.5% |