Chickasaw vs Macedonian In Labor Force | Age > 16
COMPARE
Chickasaw
Macedonian
In Labor Force | Age > 16
In Labor Force | Age > 16 Comparison
Chickasaw
Macedonians
62.3%
IN LABOR FORCE | AGE > 16
0.0/ 100
METRIC RATING
318th/ 347
METRIC RANK
65.1%
IN LABOR FORCE | AGE > 16
50.0/ 100
METRIC RATING
174th/ 347
METRIC RANK
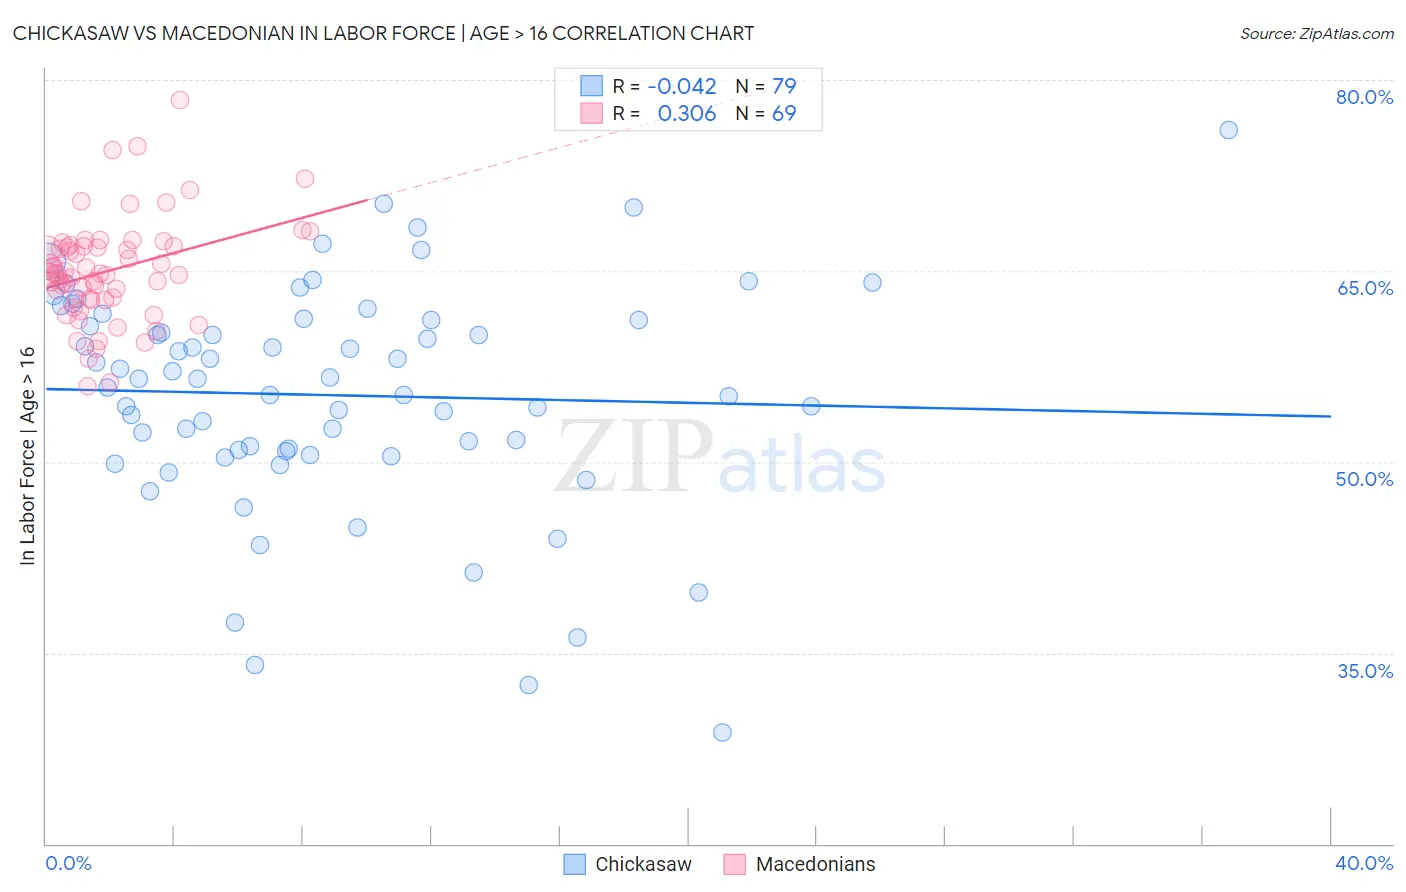
Chickasaw vs Macedonian In Labor Force | Age > 16 Correlation Chart
The statistical analysis conducted on geographies consisting of 147,722,257 people shows no correlation between the proportion of Chickasaw and labor force participation rate among population ages 16 and over in the United States with a correlation coefficient (R) of -0.042 and weighted average of 62.3%. Similarly, the statistical analysis conducted on geographies consisting of 132,660,351 people shows a mild positive correlation between the proportion of Macedonians and labor force participation rate among population ages 16 and over in the United States with a correlation coefficient (R) of 0.306 and weighted average of 65.1%, a difference of 4.5%.
In Labor Force | Age > 16 Correlation Summary
| Measurement | Chickasaw | Macedonian |
| Minimum | 28.7% | 55.9% |
| Maximum | 76.1% | 78.4% |
| Range | 47.4% | 22.5% |
| Mean | 55.2% | 65.0% |
| Median | 56.5% | 64.8% |
| Interquartile 25% (IQ1) | 50.9% | 62.8% |
| Interquartile 75% (IQ3) | 61.1% | 66.9% |
| Interquartile Range (IQR) | 10.2% | 4.2% |
| Standard Deviation (Sample) | 8.9% | 4.1% |
| Standard Deviation (Population) | 8.8% | 4.0% |
Similar Demographics by In Labor Force | Age > 16
Demographics Similar to Chickasaw by In Labor Force | Age > 16
In terms of in labor force | age > 16, the demographic groups most similar to Chickasaw are Kiowa (62.4%, a difference of 0.19%), Arapaho (62.1%, a difference of 0.24%), Yakama (62.1%, a difference of 0.25%), American (62.1%, a difference of 0.28%), and Ottawa (62.0%, a difference of 0.44%).
| Demographics | Rating | Rank | In Labor Force | Age > 16 |
| Blackfeet | 0.0 /100 | #311 | Tragic 63.2% |
| Iroquois | 0.0 /100 | #312 | Tragic 63.2% |
| Chippewa | 0.0 /100 | #313 | Tragic 63.1% |
| Yaqui | 0.0 /100 | #314 | Tragic 63.0% |
| Potawatomi | 0.0 /100 | #315 | Tragic 62.8% |
| Yup'ik | 0.0 /100 | #316 | Tragic 62.7% |
| Kiowa | 0.0 /100 | #317 | Tragic 62.4% |
| Chickasaw | 0.0 /100 | #318 | Tragic 62.3% |
| Arapaho | 0.0 /100 | #319 | Tragic 62.1% |
| Yakama | 0.0 /100 | #320 | Tragic 62.1% |
| Americans | 0.0 /100 | #321 | Tragic 62.1% |
| Ottawa | 0.0 /100 | #322 | Tragic 62.0% |
| Seminole | 0.0 /100 | #323 | Tragic 62.0% |
| Cheyenne | 0.0 /100 | #324 | Tragic 62.0% |
| Cherokee | 0.0 /100 | #325 | Tragic 61.9% |
Demographics Similar to Macedonians by In Labor Force | Age > 16
In terms of in labor force | age > 16, the demographic groups most similar to Macedonians are Nicaraguan (65.1%, a difference of 0.0%), Swedish (65.1%, a difference of 0.030%), Immigrants from Ukraine (65.1%, a difference of 0.040%), Eastern European (65.1%, a difference of 0.040%), and Trinidadian and Tobagonian (65.1%, a difference of 0.050%).
| Demographics | Rating | Rank | In Labor Force | Age > 16 |
| Immigrants | Belarus | 66.0 /100 | #167 | Good 65.2% |
| Serbians | 63.5 /100 | #168 | Good 65.2% |
| Arabs | 62.4 /100 | #169 | Good 65.2% |
| Immigrants | Israel | 61.7 /100 | #170 | Good 65.2% |
| Israelis | 61.6 /100 | #171 | Good 65.2% |
| Immigrants | Sweden | 61.3 /100 | #172 | Good 65.2% |
| Immigrants | Ukraine | 53.7 /100 | #173 | Average 65.1% |
| Macedonians | 50.0 /100 | #174 | Average 65.1% |
| Nicaraguans | 49.7 /100 | #175 | Average 65.1% |
| Swedes | 47.4 /100 | #176 | Average 65.1% |
| Eastern Europeans | 46.2 /100 | #177 | Average 65.1% |
| Trinidadians and Tobagonians | 45.2 /100 | #178 | Average 65.1% |
| Immigrants | Haiti | 43.3 /100 | #179 | Average 65.1% |
| Immigrants | Latvia | 42.9 /100 | #180 | Average 65.1% |
| Immigrants | Panama | 42.4 /100 | #181 | Average 65.1% |