American vs Brazilian In Labor Force | Age > 16
COMPARE
American
Brazilian
In Labor Force | Age > 16
In Labor Force | Age > 16 Comparison
Americans
Brazilians
62.1%
IN LABOR FORCE | AGE > 16
0.0/ 100
METRIC RATING
321st/ 347
METRIC RANK
66.6%
IN LABOR FORCE | AGE > 16
100.0/ 100
METRIC RATING
46th/ 347
METRIC RANK
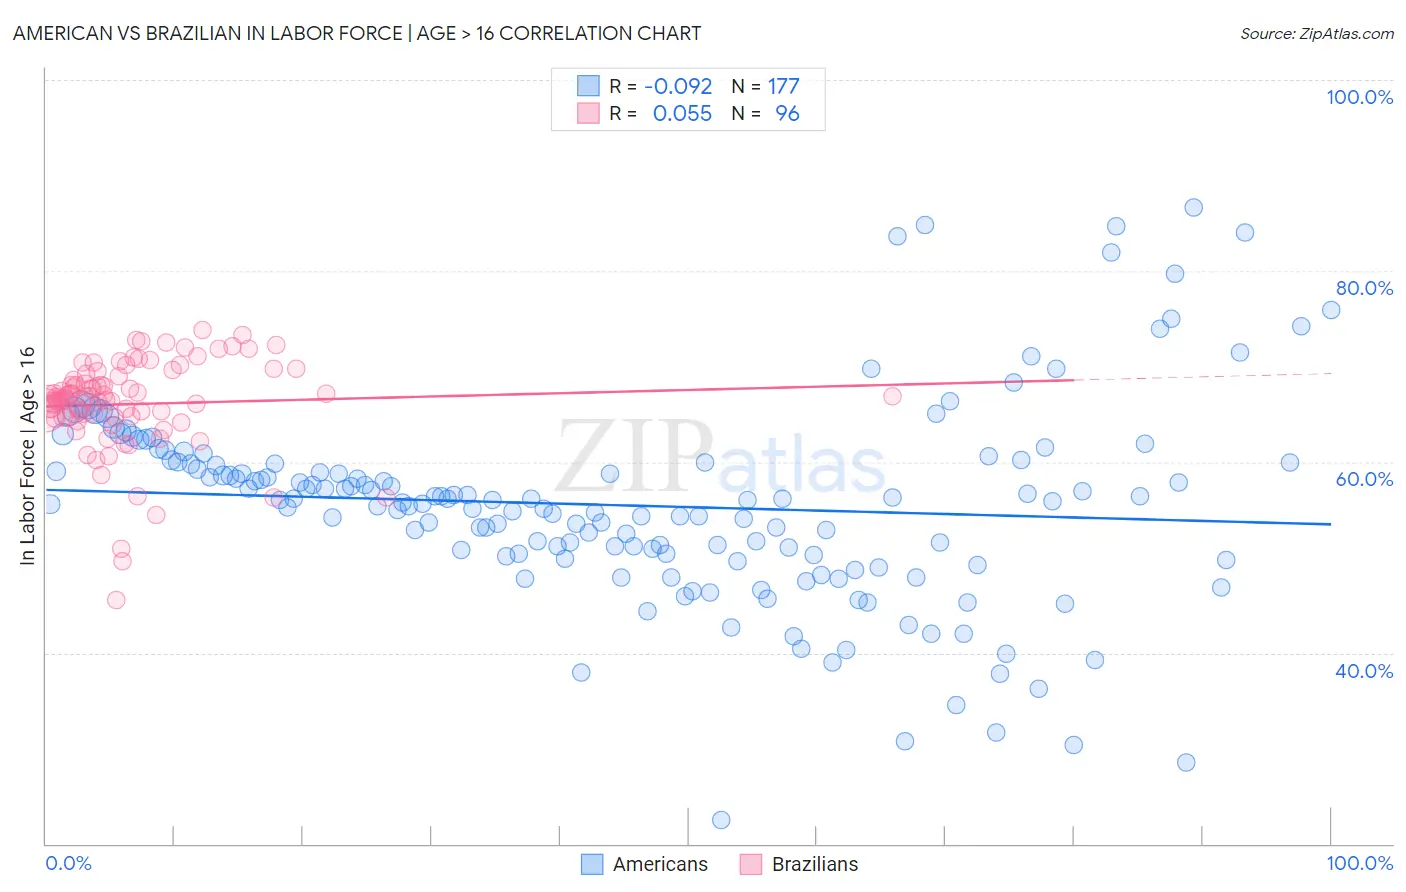
American vs Brazilian In Labor Force | Age > 16 Correlation Chart
The statistical analysis conducted on geographies consisting of 581,977,870 people shows a slight negative correlation between the proportion of Americans and labor force participation rate among population ages 16 and over in the United States with a correlation coefficient (R) of -0.092 and weighted average of 62.1%. Similarly, the statistical analysis conducted on geographies consisting of 323,965,381 people shows a slight positive correlation between the proportion of Brazilians and labor force participation rate among population ages 16 and over in the United States with a correlation coefficient (R) of 0.055 and weighted average of 66.6%, a difference of 7.2%.
In Labor Force | Age > 16 Correlation Summary
| Measurement | American | Brazilian |
| Minimum | 22.4% | 45.5% |
| Maximum | 86.7% | 73.8% |
| Range | 64.3% | 28.3% |
| Mean | 55.4% | 66.1% |
| Median | 56.0% | 66.8% |
| Interquartile 25% (IQ1) | 50.2% | 64.6% |
| Interquartile 75% (IQ3) | 59.9% | 69.1% |
| Interquartile Range (IQR) | 9.8% | 4.5% |
| Standard Deviation (Sample) | 10.5% | 5.0% |
| Standard Deviation (Population) | 10.4% | 4.9% |
Similar Demographics by In Labor Force | Age > 16
Demographics Similar to Americans by In Labor Force | Age > 16
In terms of in labor force | age > 16, the demographic groups most similar to Americans are Arapaho (62.1%, a difference of 0.040%), Yakama (62.1%, a difference of 0.040%), Ottawa (62.0%, a difference of 0.16%), Seminole (62.0%, a difference of 0.18%), and Cheyenne (62.0%, a difference of 0.22%).
| Demographics | Rating | Rank | In Labor Force | Age > 16 |
| Yaqui | 0.0 /100 | #314 | Tragic 63.0% |
| Potawatomi | 0.0 /100 | #315 | Tragic 62.8% |
| Yup'ik | 0.0 /100 | #316 | Tragic 62.7% |
| Kiowa | 0.0 /100 | #317 | Tragic 62.4% |
| Chickasaw | 0.0 /100 | #318 | Tragic 62.3% |
| Arapaho | 0.0 /100 | #319 | Tragic 62.1% |
| Yakama | 0.0 /100 | #320 | Tragic 62.1% |
| Americans | 0.0 /100 | #321 | Tragic 62.1% |
| Ottawa | 0.0 /100 | #322 | Tragic 62.0% |
| Seminole | 0.0 /100 | #323 | Tragic 62.0% |
| Cheyenne | 0.0 /100 | #324 | Tragic 62.0% |
| Cherokee | 0.0 /100 | #325 | Tragic 61.9% |
| Sioux | 0.0 /100 | #326 | Tragic 61.8% |
| Cajuns | 0.0 /100 | #327 | Tragic 61.8% |
| Dutch West Indians | 0.0 /100 | #328 | Tragic 61.7% |
Demographics Similar to Brazilians by In Labor Force | Age > 16
In terms of in labor force | age > 16, the demographic groups most similar to Brazilians are Immigrants from Bulgaria (66.6%, a difference of 0.0%), Nigerian (66.6%, a difference of 0.010%), Immigrants from Northern Africa (66.6%, a difference of 0.030%), Immigrants from Brazil (66.7%, a difference of 0.070%), and Cape Verdean (66.6%, a difference of 0.080%).
| Demographics | Rating | Rank | In Labor Force | Age > 16 |
| Salvadorans | 100.0 /100 | #39 | Exceptional 66.8% |
| Immigrants | El Salvador | 100.0 /100 | #40 | Exceptional 66.8% |
| Immigrants | Zimbabwe | 100.0 /100 | #41 | Exceptional 66.8% |
| Senegalese | 100.0 /100 | #42 | Exceptional 66.7% |
| Luxembourgers | 100.0 /100 | #43 | Exceptional 66.7% |
| Immigrants | Pakistan | 100.0 /100 | #44 | Exceptional 66.7% |
| Immigrants | Brazil | 100.0 /100 | #45 | Exceptional 66.7% |
| Brazilians | 100.0 /100 | #46 | Exceptional 66.6% |
| Immigrants | Bulgaria | 100.0 /100 | #47 | Exceptional 66.6% |
| Nigerians | 100.0 /100 | #48 | Exceptional 66.6% |
| Immigrants | Northern Africa | 100.0 /100 | #49 | Exceptional 66.6% |
| Cape Verdeans | 100.0 /100 | #50 | Exceptional 66.6% |
| Immigrants | Kuwait | 100.0 /100 | #51 | Exceptional 66.5% |
| Paraguayans | 99.9 /100 | #52 | Exceptional 66.5% |
| Immigrants | Sri Lanka | 99.9 /100 | #53 | Exceptional 66.5% |