Peruvian vs Brazilian In Labor Force | Age > 16
COMPARE
Peruvian
Brazilian
In Labor Force | Age > 16
In Labor Force | Age > 16 Comparison
Peruvians
Brazilians
66.3%
IN LABOR FORCE | AGE > 16
99.8/ 100
METRIC RATING
64th/ 347
METRIC RANK
66.6%
IN LABOR FORCE | AGE > 16
100.0/ 100
METRIC RATING
46th/ 347
METRIC RANK
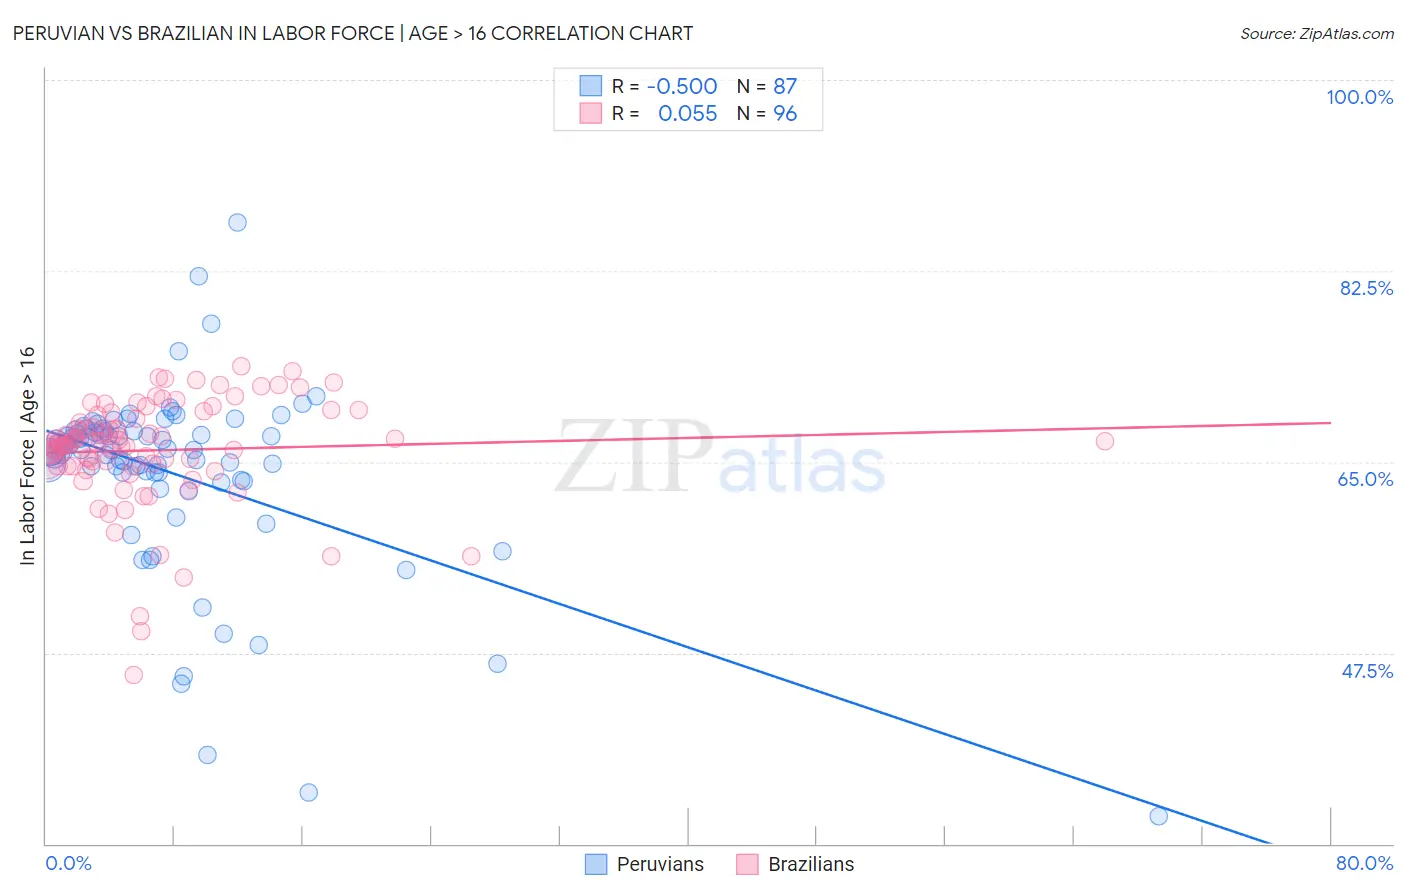
Peruvian vs Brazilian In Labor Force | Age > 16 Correlation Chart
The statistical analysis conducted on geographies consisting of 363,253,331 people shows a moderate negative correlation between the proportion of Peruvians and labor force participation rate among population ages 16 and over in the United States with a correlation coefficient (R) of -0.500 and weighted average of 66.3%. Similarly, the statistical analysis conducted on geographies consisting of 323,965,381 people shows a slight positive correlation between the proportion of Brazilians and labor force participation rate among population ages 16 and over in the United States with a correlation coefficient (R) of 0.055 and weighted average of 66.6%, a difference of 0.51%.
In Labor Force | Age > 16 Correlation Summary
| Measurement | Peruvian | Brazilian |
| Minimum | 32.5% | 45.5% |
| Maximum | 86.9% | 73.8% |
| Range | 54.4% | 28.3% |
| Mean | 64.0% | 66.1% |
| Median | 66.1% | 66.8% |
| Interquartile 25% (IQ1) | 63.4% | 64.6% |
| Interquartile 75% (IQ3) | 67.8% | 69.1% |
| Interquartile Range (IQR) | 4.4% | 4.5% |
| Standard Deviation (Sample) | 8.6% | 5.0% |
| Standard Deviation (Population) | 8.6% | 4.9% |
Demographics Similar to Peruvians and Brazilians by In Labor Force | Age > 16
In terms of in labor force | age > 16, the demographic groups most similar to Peruvians are Venezuelan (66.3%, a difference of 0.0%), Sri Lankan (66.3%, a difference of 0.010%), Immigrants from Peru (66.3%, a difference of 0.040%), Immigrants from Burma/Myanmar (66.3%, a difference of 0.040%), and Indonesian (66.3%, a difference of 0.040%). Similarly, the demographic groups most similar to Brazilians are Immigrants from Bulgaria (66.6%, a difference of 0.0%), Nigerian (66.6%, a difference of 0.010%), Immigrants from Northern Africa (66.6%, a difference of 0.030%), Immigrants from Brazil (66.7%, a difference of 0.070%), and Cape Verdean (66.6%, a difference of 0.080%).
| Demographics | Rating | Rank | In Labor Force | Age > 16 |
| Immigrants | Brazil | 100.0 /100 | #45 | Exceptional 66.7% |
| Brazilians | 100.0 /100 | #46 | Exceptional 66.6% |
| Immigrants | Bulgaria | 100.0 /100 | #47 | Exceptional 66.6% |
| Nigerians | 100.0 /100 | #48 | Exceptional 66.6% |
| Immigrants | Northern Africa | 100.0 /100 | #49 | Exceptional 66.6% |
| Cape Verdeans | 100.0 /100 | #50 | Exceptional 66.6% |
| Immigrants | Kuwait | 100.0 /100 | #51 | Exceptional 66.5% |
| Paraguayans | 99.9 /100 | #52 | Exceptional 66.5% |
| Immigrants | Sri Lanka | 99.9 /100 | #53 | Exceptional 66.5% |
| Immigrants | Bosnia and Herzegovina | 99.9 /100 | #54 | Exceptional 66.5% |
| Immigrants | Venezuela | 99.9 /100 | #55 | Exceptional 66.4% |
| Immigrants | Senegal | 99.9 /100 | #56 | Exceptional 66.4% |
| Bulgarians | 99.9 /100 | #57 | Exceptional 66.4% |
| Immigrants | Saudi Arabia | 99.9 /100 | #58 | Exceptional 66.3% |
| Immigrants | Turkey | 99.9 /100 | #59 | Exceptional 66.3% |
| Immigrants | Peru | 99.8 /100 | #60 | Exceptional 66.3% |
| Immigrants | Burma/Myanmar | 99.8 /100 | #61 | Exceptional 66.3% |
| Indonesians | 99.8 /100 | #62 | Exceptional 66.3% |
| Venezuelans | 99.8 /100 | #63 | Exceptional 66.3% |
| Peruvians | 99.8 /100 | #64 | Exceptional 66.3% |
| Sri Lankans | 99.8 /100 | #65 | Exceptional 66.3% |